- What is inferential statistics?
- Why is the Normal Distribution so important?
- What is an i.i.d random sample?
- How does sample size impact the confidence interval? What is a paired t-test?
- What is the OLS estimator all about?
What is descriptive statistics and inferential statistics?
Descriptive statistics can be used to summarize the data, either numerically or graphically, to describe the sample (e.g., mean and standard deviation). Taken from all data
for randomness and drawing inferences about the larger population.
Sample
Inferential statistics is used to model patterns in the data, accounting for randomness and drawing inferences about the larger population. Taken from a sample
These inferences may take the form of:
- estimates of numerical characteristics (estimation)
- answers to yes/no questions (hypothesis testing),
- forecasting of future observations (forecasting),
- descriptions of association (correlation), or
- modeling of relationships (regression).
Data Mining is sometimes referred to as exploratory statistics generating new hypotheses.
What are random variables?
𝑋 is a random variable if it represents a random draw from some population, and is associated with a probability distribution.
- a discrete random variable can take on only selected values (e.g., Binomial or Poisson distributed), Person height
- a continuous random variable can take on any value in a real interval (e. g., uniform, Normal or Chi-Square distributions) 0-180 Grad
For example, a Normal distribution, with mean 𝜇 and variance 𝜎2 is written as 𝑁(μ, σ2) has a pdf of
f(x) = (1 / σ sqrt(2π)e)-(x-μ)^2/2σ^2
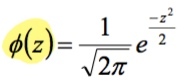
The Standard Normal
Any random variable can be “standardized” by subtracting the mean, 𝜇, and dividing by the standard deviation, 𝜎 , so
𝐸𝑍 =0,𝑉𝑎𝑟𝑍 =1.
Thus, the standard normal, 𝑁 0,1 , has probability density function (pdf):
Statistical Estimation
Populiation with parameters -every member of the population has the same chance to be selected-> Random sample
Random sample -estimation-> Population
Expected Value of X: Population Mean E(X)
- The expected value is a probability weighted average of 𝑋
- 𝐸(𝑋) is the mean or expected value of the distribution of 𝑋, denoted by u𝑥
- Let 𝑓(𝑥𝑖) be the (discrete) probability that X = 𝑥𝑖, then
- ux= 𝐸(𝑋)=(n bis i=1)Σxi f(xi)
- Law of large numbers: the average of the results obtained from a large number of trials should be close to the expected value, and will tend to become closer as more trials are performed.
Sampling Distribution of the Mean
- We can say something about the distribution of sample statistics (such as the sample mean)
- The sample mean is a random variable, and consequently it has its own distribution and variance
- The distribution of sample means for different samples of a population is centered on the population mean
- The mean of the sample means is equal to the population mean
- If the population is normally distributed or when the sample size is large, sample means are distributed normally
Examples of Estimators
- Suppose we want to estimate the population mean
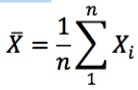
- Suppose we use the formula for 𝐸(𝑋), but substitute 1/𝑛 for 𝑓(𝑥𝑖) as the probability weight since each point has an equal chance of being included in the sample, then we can calculate the sample mean:
- 𝑋 describes the random variable for the arithmetic mean of the sample, while 𝑥 is the mean of a particular realization of a sample.
Estimators should be Unbiased
An estimator (e.g., the arithmetic sample mean) is a statistic (a function of the observable sample data) that is used to estimate an unknown population parameter (e.g., the expected value)
Standard Error of the Mean: Standard Deviation of Sample Means
The standard deviation of the sample means is equal to the standard deviation of the population divided by the square root of the sample size.
σ / sqrt(n)
Rule:Var[aX + b] a2 Var[X]
Random Samples and Sampling
- For a random variable 𝑋, repeated draws from the same population can be labeled as 𝑋1, 𝑋2, . . . , 𝑋𝑛
- If every combination of 𝑛 sample points has an equal chance of being selected, this is a random sample
- A random sample is a set of independent, identically distributed (i.i.d) random variables
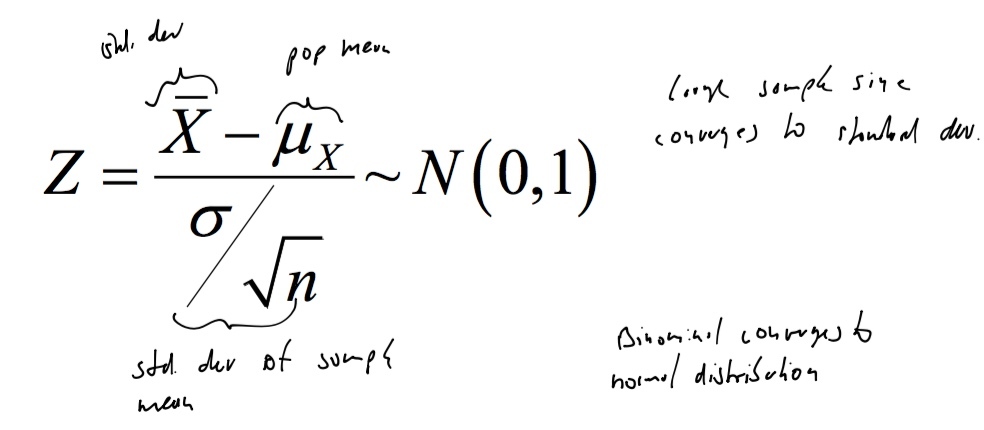
Central Limit Theorem
- The central limit theorem states that the standardized average of any population of i.i.d. random variables 𝑋𝑖 with mean 𝜇𝑋 and variance 𝜎2 is asymptotically ~𝑁(0,1), or
- Asymptotic Normality implies that 𝑃(𝑍 < 𝑧) Φ(𝑧) as
𝑛 –> unendlich , 𝑜𝑟 𝑃(𝑍 < 𝑧) ≈ Φ(𝑧) - In other words:
- 𝑋1, … , 𝑋𝑛 be 𝑛 i.i.d. random variables with mean μ and standard deviation σ.
- If 𝑛 is sufficiently large, the sample mean X is approximately
- Normal with mean μ and standard deviation 𝜎/√𝑛
- i.e., the mean of the sample means is equal to the population mean
- i.e., the standard deviation of the sample means is equal to the standard deviation of the population divided by the square root of the sample size
- Normal with mean μ and standard deviation 𝜎/√𝑛
Statistical Estimation
- Population with mean: μ= ? –>
- A simple random sample of 𝑛 elements is selected from the population. –>
- The sample data provide a value for the sample mean 𝑥 –>
- The value of 𝑥 is used to make inferences about the value of μ.
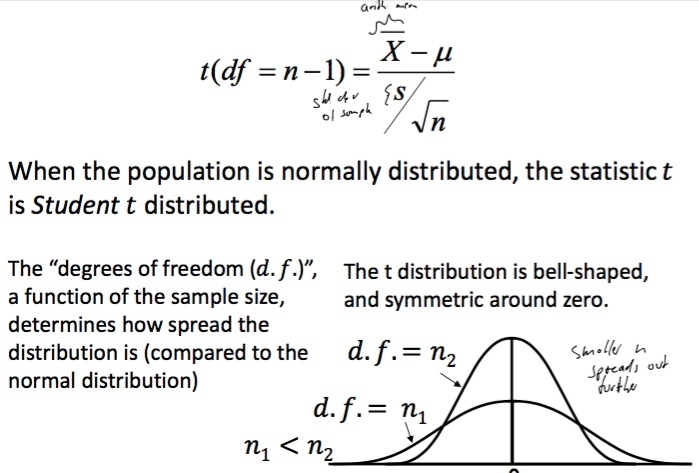
Student‘s t-Distribution
- When the population standard deviation is not known, or when the sample size is small, the Student‘s t-distribution should be used
- This distribution is similar to the Normal distribution, but more spread out for small samples
- The formula for standardizing the distribution of sample means to the t-distribution is similar, except that the sample standard deviation 𝒔 is used
Student t-Distribution
Statistical Estimation (Types)
- Point estimate
- sample mean
- sample proportion
- Point estimate
- sample mean
- sample proportion
- Point estimate is always within the interval estimate
Confidence Interval (CI)
Provide us with a range of values that we believe, with a given level of confidence, contains a population parameter CI for the population means:
Pr(X - 1.96SD <= µ <= X + 1.96SD) = 0.95
lower bound and upper bound.
There is a 95% chance that your interval contains 𝜇.
Example: Standard Normal Distribution
Suppose sample of 𝑛=100 persons mean = 215, standard deviation = 20
95% CI = X +- 1.96s / sqrt(n)
- Lower Limit: 215 – 1.96*20/10
- Upper Limit: 215 + 1.96*20/10
- = (211, 219)
“We are 95% confident that the interval 211-219 contains 𝜇”
Effect of Sample Size
Suppose we had only 10 observations What happens to the confidence interval?
X +- 1.96s / sqrt(n)
- For n = 100, 215 1.96(20) / 100 (211,219)
- For n = 10, 215 1.96(20) / 10 (203,227)
- Larger sample size = smaller interval
Suppose we use a 90% interval
What happens to the confidence interval?
X +- 1.645s / sqrt(n)
90%: 215 1.645(20) / sqrt(100) = (212,218)
Lower confidence level = smaller interval (A 99% interval would use 2.58 as multiplier and the interval would be larger)
Effect of Standard Deviation
Suppose we had a SD of 40 (instead of 20) What happens to the confidence interval?
X 1.96s/ sqrt(n)
215 +- 1.96(40)/ sqrt(100) = (207,223)
More variation = larger interval
Statistical Inference
- Formulate hypothesis
- Collect data to test hypothesis <– Systematic error
- Accept hypothesis
- Reject hypothesis
Random error (chance) can be controlled by statistical significance or by confidence interval
Hypothesis Testing
- State null and alternative hypothesis (Ho and Ha)
- Ho usually a statement of no effect or no difference between groups
- Choose α level (related to confidence level) } how much do
- Probability of falsely rejecting Ho (Type I error), typically 0.05 or 0.01
- Calculate test statistic, find p-value (p)
- Measures how far data are from what you expect under null hypothesis
- State conclusion:
- 𝑝 ≤ 𝛼, reject Ho
- 𝑝 > 𝛼, insufficient evidence to reject Ho
Possible Results of Tests
- Null true and Reject Null = Type I (alpha error)
- Null true and Fail to reject Null = Correct
- Null false and Reject Null = Correct
- Null false and Fail to reject Null = Type II error (ß)
-
Chapter 1: Introduction22
-
Chapter 2: Statistics Revisited30
-
Tutorial 2: Statistics4
-
Chapter 3: Multiple Regression Panel Data29
-
Chapter 4: Logistic and Poisson Regressions24
-
Chapter 5: Naive Bayes25
-
Chapter 6: Decision Trees32
-
Tutorial 5: Naive Bayas4
-
Chapter 7: Pruning in Decision Trees Data Preparation40
-
Chapter 8: Evaluation of Classifiers33
-
Tutorials Theorie16
