When data is graphed it tends to naturally take what shape? List characteristics? (2)
- normal distribution -most points fall in centre, fewer towards extremes
What is an example of the naturally occurring standard distribution?
- Galton Board
What are the four characteristics of Normal Distribution?
- symmetrical and bell-shaped 2. mean, median mode 3. asymptotic= extends forever without touching axis 4. area under the curve equals one
What are the two parameters of Normal Distribution?
- mean 2. standard deviation
What are the normal distribution probabilities for 1, 2 and 3 standard deviations?
+/- 1= 68% +/- 2= 95% +/- 3= 99% anything after that is ~100%
What is a Z score?? (2)
- A score that indicates how many standard deviations a raw score deviates from the mean 2. Comparisons relative to other participants
How do you interpret a Z score? (2)
- Sign indicates above or below the mean ( left or right) 2. Magnitude indicates typical or atypical score!
What is an Atypical score and a typical score?
- Atypical- outlier…not close to the mean… 2. Typical- closer to the mean…zero
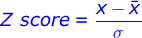
What is the standard scores (z-scores) equation for populations and samples?
X=raw score to be standardized
X bar= mean of population
o= standard deviation of population
*** difference between z score pop and z score sample is that the z score sample has a S!…
Z scores are generally what?
- unit free…..allowing one to compare distributions that have different units…
Standard scores ( z scores) characteristics?
(3)
- How many SD’s a raw score varies from the mean
- Directionality (+/-) = above or below mean
- Magnitude = close or far from mean…
With every Z score question you should draw what??
-standard distribution curve ! to help with solving the question..
You can rearrange the z score formula to also solve for?
- the raw score…..
Z scores can determine the area associated with z scores and therefore the __________ are also possible to find.
The percentages of scores __ or ____ a given raw score.
- percentile rank
- at, below
When looking at a Zscore chart……What does Comumn A, B and C represent?
- A: z score ( always positive )
- B: area between mean and z score
- C: area beyond the z score
-
Chapter 1: Statistics and the Scientific Method20
-
Chapter 2: Statistical Variation20
-
Chapter 3: Frequency Distributions21
-
Chapter 4: Measures of Central Tendency17
-
Chapter 5: Normal Distribution Standard Scores16
-
Chapter 6: Correlation and Predicted Variance30
-
Chapter 7: Linear Regression11
-
Chapter 12: Sampling Distribution of the Mean and Z-test34
-
Chapter 12: Power and Power calculations17
-
Chapter 13 : Single Sample t-Test26
-
Chapter 14: Correlated Groups t-Test11
-
Chapter 14: Independent Group t-Test23
-
Chapter 15: One Way ANOVA45
-
Chapter 16: Two Way ANOVA20
-
Chapter 17: Nonparamatric Tests - Chi Square24
-
Chapter 17: Nonparamatric Tests - Wilcoxin Matched Pairs Signed Rank5
-
Chapter 17: Nonparamatric Tests - Mann-Whintey U Test3
-
Chapter 17: Nonparamatric Tests- Kriskul-Wallis Test8
-
Repeated Measures ANOVA6
-
Multiple Regression31
-
Repeated Measures 2-way ANOVA2
