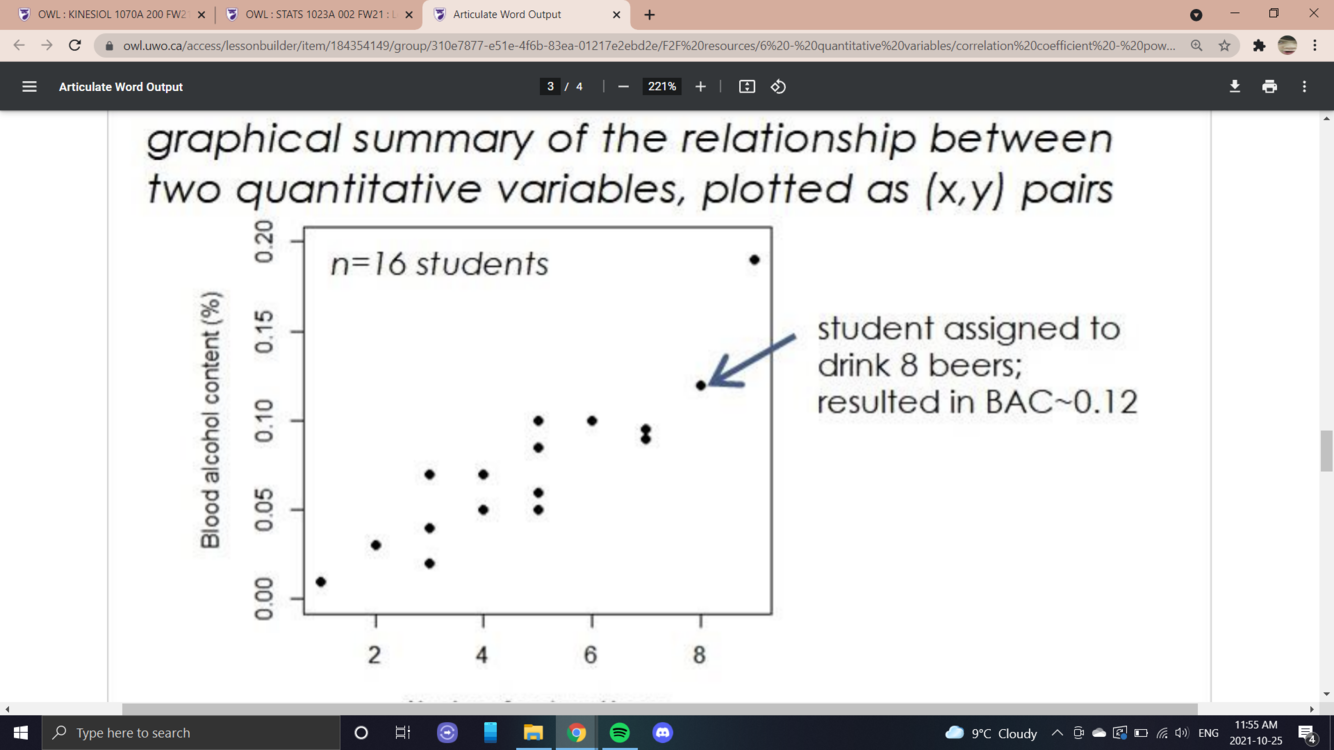
scatterplots
graphical summary of the relationship between two quantitative variables, plotted as (x, y) pairs
the straight line is called a regression line
must determine which varible is
- explantory variable (predictor, independant) variable (x)
- response (dependant) variable (y)
the regression line describes how the response variable changes as the explanatory variable changes
- the process of fitting a line through the data means drawing a line that comes as close as possible to the points
- equation of this line will be given by: y = a + bx
a = intercept coefficient
b = slope coefficient
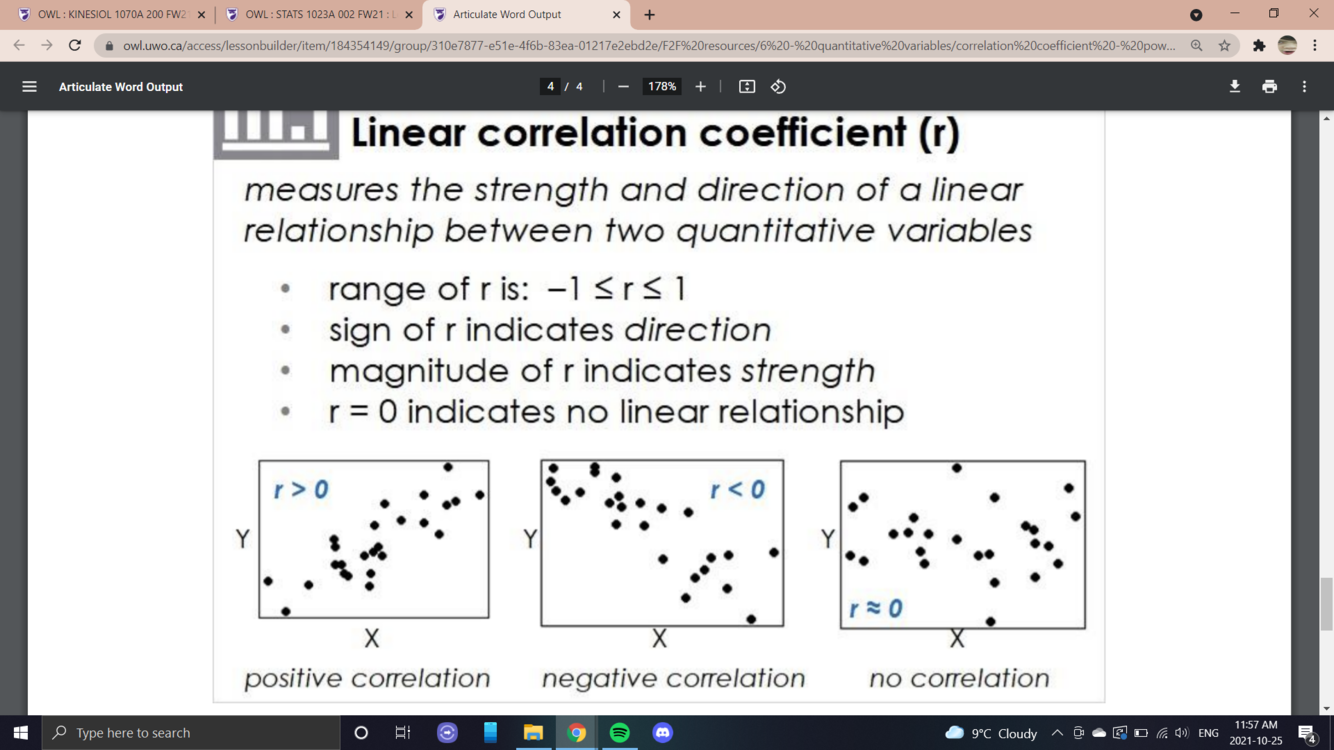
linear correlation coefficient (r)
measures the strength and direction of a linear relationship between two quantitative variables
- range of r is less than or equal to 1, greater or equal to -1
- sign of r indicates direction
- magnitude of r indicates strength of linear relationship between 2 variables
- r = 0 indicates no linear relationship or close to 0 mean weak relationship
- positive values of r is (+x), (+y) negative values of r is (+x), (-y)
regression line for prediction
after the fitted regression equation, use it to predict variables of y for any value of x (even for values of x that were not in the original sample data)
- making use of a regression line for prediction outside the range of data is called extrapolation and should not be done
- we only know about the relationship for observed range of x values
outliers
observations that lie outside the overall pattern of other observations
influential points
observations that, if removed, would considerably change correlation or line
best method to establish a relationship
best method: manipulate explantory variable in an experiment institute control for other variables
- show a strong and consistent association
- have an alleged cause preceding the effect in time
- have an alleged cause that is plausible
ex) in studies of lung cancer among people who smoked or not - observational studies were done since individuals had decided to become smokers before the data was collected
- it was once argued that people who choose to smoke may be more susceptible to lung cancer due to other reasons
- further evidence has shown a strong link between the two
people who smoke more often or a longer period get lung cancer more often put people who stop reduce risk
lung cancer develops after years of smoking and was rare among women until wmen began to smoke
non-observational animal studies have shawn tar from cigarettes does cause cancer
-
intro to statistics and data17
-
sampling and survey designs24
-
measurements and surveys12
-
research ethics15
-
interpreting numerical summaries14
-
Interpreting Graphical Summaries12
-
Correlation and Linear Regression6
-
Two-way tables, risks, & odds15
-
Probability & Normal Curves15
-
Sampling Variability and Confidence Intervals8
-
Hypothesis Testing10
-
Seven Critical Components3
