When summarising and looking at relationships in data, what is the first stage?
summarise what the values look like
e.g. where does the quantitative data sit in numerical space?
what categorical data is more or less common?
then understand any relationships between different properties that data has been collected on (through analysis)
What does the analysis that is conducted depend on?
the data itself:
- how is the data recorded?
- how is the data distributed?
the research question:
- will this analysis answer what i’m trying to ask?
Why does a user (someone reading a report) need to know about statistics?
They need to know enough about what the researcher should have done, to know if their results are accurate and meaningful
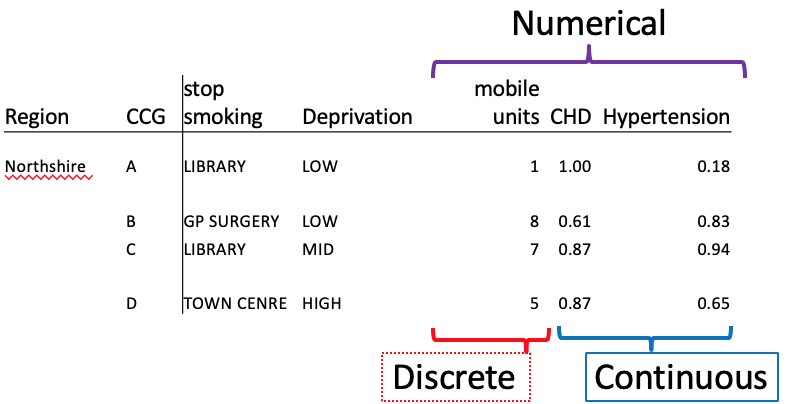
How is categorical data usually recorded?
it is recorded as text (or labelled)
it is ordinal if there is some way to order or rank the data
Why is deprivation ordinal data?
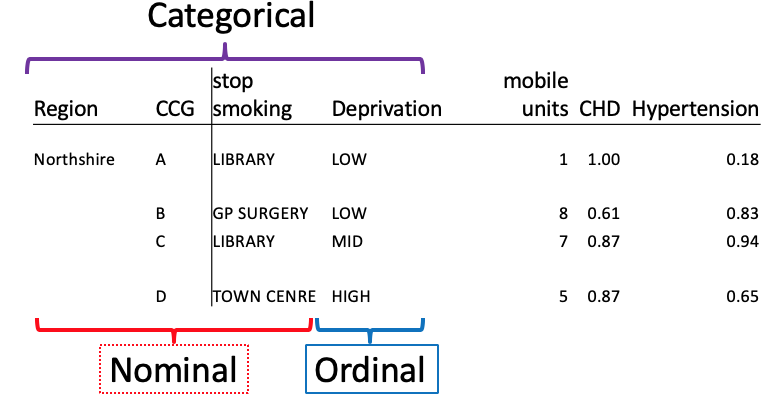
there is a way to order the data (low, medium, high)
the others are nominal
How is categorical data described?
you need to show how often each category is seen
this is done through counts or percentages
it is shown through tables and graphs
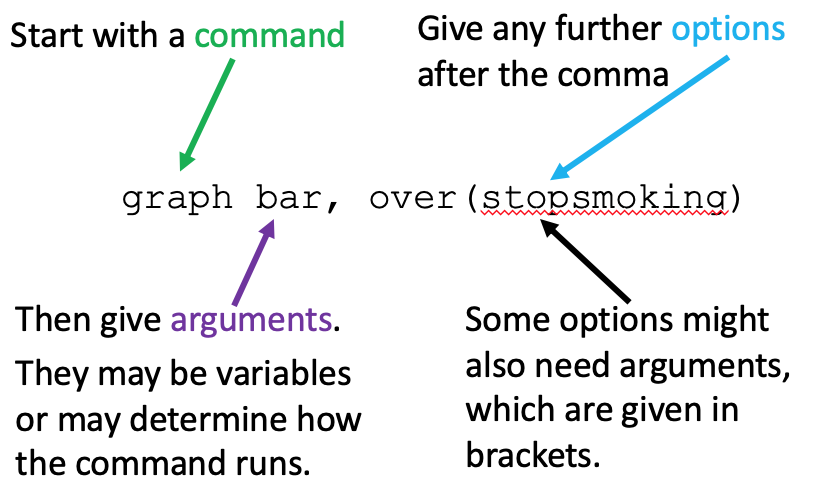
What is the following STATA command structure?
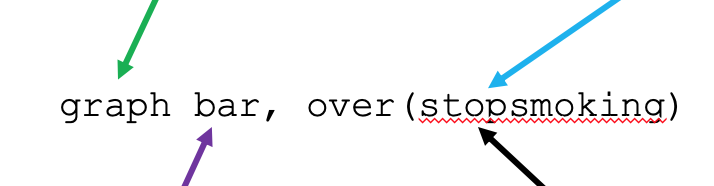
the command name comes first, followed by arguments for the command to use (usually variable names)
What method is used for testing relationships involving categorical data?
logistic regression
What tests are used for testing relationships when there is one categorical variable and one continuous variable?
T-tests
Chi squared
What is meant by numerical data?
What are the 2 types?
the data involves numbers - you can count or measure the values
it is discrete if only whole numbers make sense
it is continuous if the data can take any value
How is numerical data described?
- give a summary of the size of the values using mean or median
- give a summary of the spread of the variables
using variance, standard deviation, interquartile range
- report some sort of extreme
minimum, maximum, modal value
What is the problem in using a point plot to describe numerical data?
It is quick, but not very useful
Summary measures are more useful for numerical data
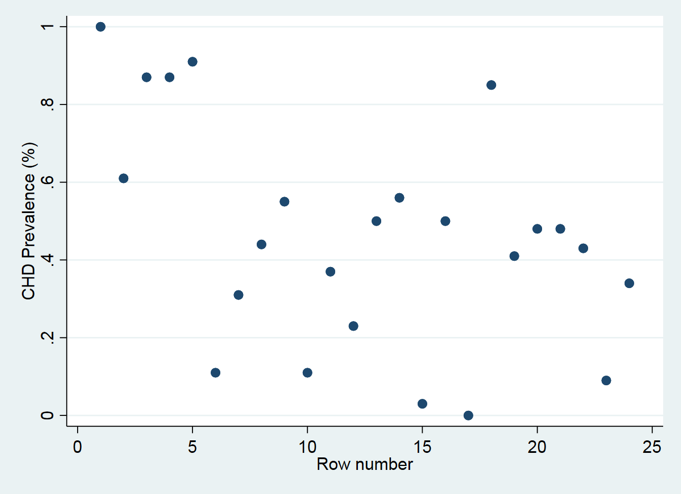
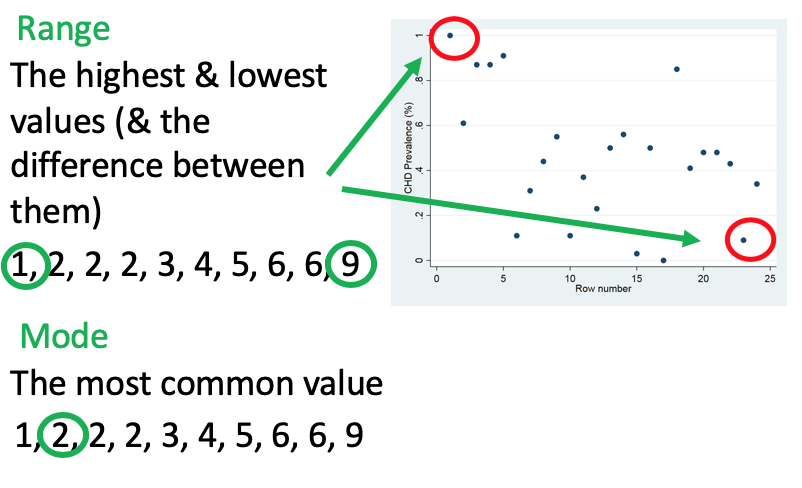
From the point plot, what values can be worked out?

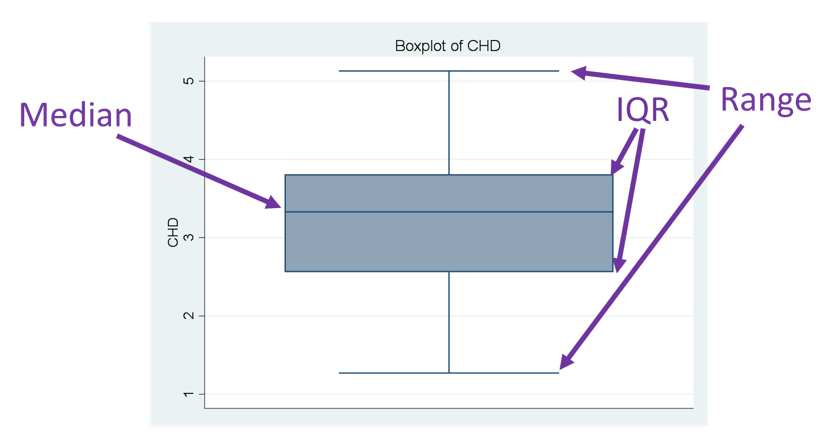
Range:
this is the highest and lowest values and the difference between them
Mode:
this is the most common value
Why are histograms used for numerical data?
What do they show?
histograms show how common the values are relative to each other
this allows you to see where the typical, or most common values fall
What type of distribution is shown here?
Why is it important to recognise this?
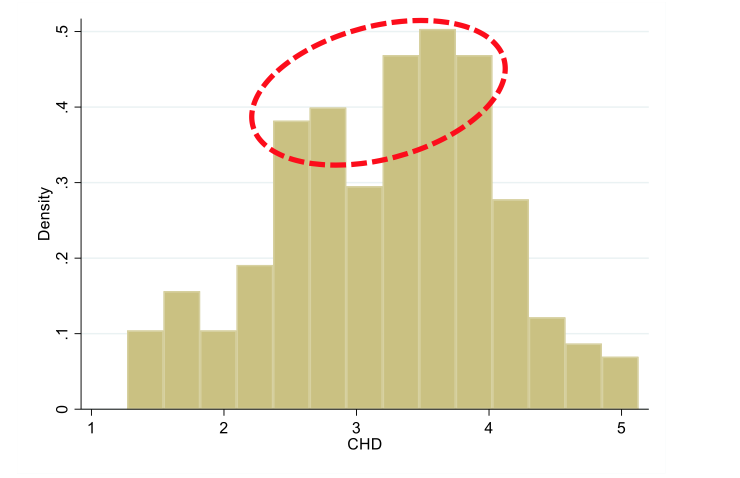
the most common values fall around the middle, forming a roughly symmetrical curve
this data is normally distributed
this is important for choosing how best to summarise the data
What are the best summary measures to use when you have normally distributed data?
mean and standard deviation
What are the mean and standard deviation?
How are they calculated?
Mean:
- where, on average, the values lie
- this is the sum of all the values / total number of values
Standard deviation:
- this is the average spread of values around the mean
- the mean is subtracted from each value, the total is then divided by one less than the total number of values
- the root of this value is the SD
What STATA command would be used to identify the mean and standard deviation?
the summarize command
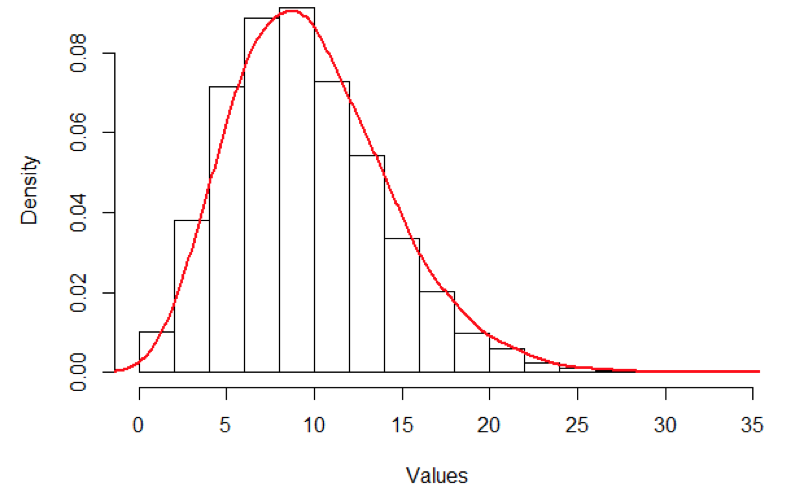
What type of distribution is shown here?
left skew
some of the low values are fairly rare, making a long tail
the peak of the curve is shifted over to the higher values
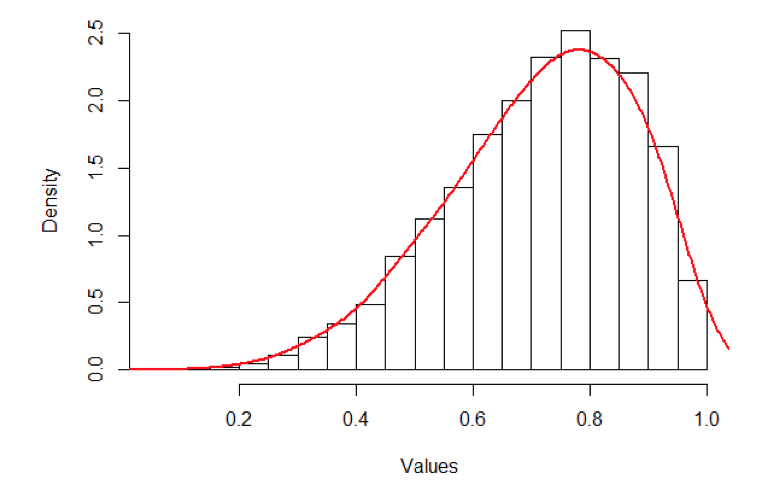
What type of distribution is shown here?
right skew
If data shows a right or left skew, what summary statistics are used?
median and interquartile range
What is the median and how is it calculated?
it is the mid-point of the measurements
it can be found by putting all of the values in order and finding the mid-point
if there is a tie, the median lies exactly between the middle two values
What is the interquartile range and how is it calculated?
it is the spread of values around the median
it is the difference between the value that is one quarter of the way into the data, and the value that is three quarters of the way in
What type of graph is used to visualise the IQR?
box plot