What do correlation coefficient (r) tests do?
Measure strength of a relationship between two continuous variables measures between r = -1 and 1 -1 - negative linear 0 - no linear relationship 1 - positive linear
How do we interpret the correlation coefficient?
-0.3 to 0.3: weak -0.5 to -0.3 or 0.3 to 0.5: moderate -0.9 to -0.5 or 0.5 to 0.9: strong -1.0 to -0.9 or 0.9 to 1.0: very strong
When is regression useful?
Regression is useful when we want to:
- look for significant relationships between 2 variables
- predict a value of one variable for a given value of the other
- it involves estimating the line of best fit through the data which minimises the sum of the squared residuals
What are residuals?
The differences between the observed and predicted weights
What do we assume about regression and what do we plot to check?
- the relationship between the independent and dependent variables is linear - check using original scatter plot of dep and indep variables
- the variance of the residuals about predicted responses should be the same for all predicted responses - check using plots of standardised predicted values and residuals
- The residuals are independently normally distributed - check by plotting residuals in histogram
How do we check normality?
Histogram of residuals looks approx. normally distributed
What shape suggests problems for residuals?
A funneling shape
What if assumptions are not met for regression?
If residuals are heavily skewed or residuals show diff variances as predicted values increase, the data needs to be transformed Try taking natural log (ln) of dependent variable. Then repeat analysis and check the assumptions
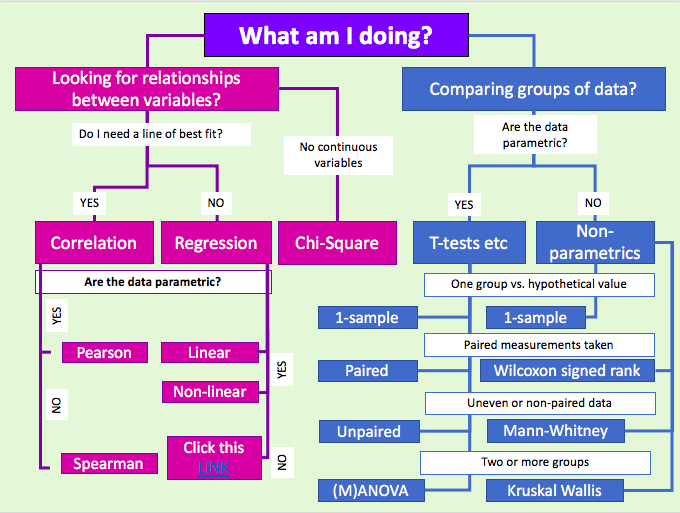
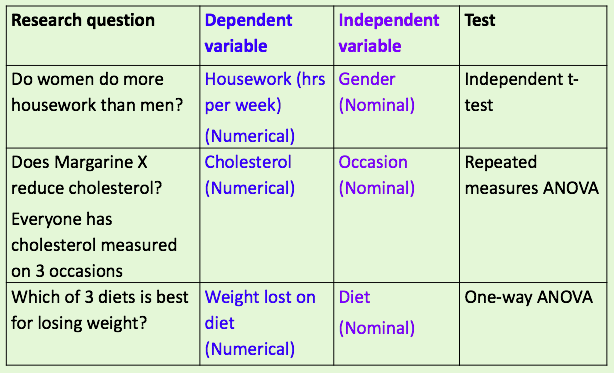
What are the steps to choosing the right test?
- Research question must be clear with measurable quantities.
- dependent variables: what variable is the dependent? (think about type of data)
- data types
- comparing means
- Do you have repeated measures?
What are the two types that stats tests fall into?
Parametric
assume data follows a particular distribution e.g. normal distribution
Non-parametric
usually based on ranks/signs rather than actual data
- numerical data is ordered and ranked, analysis is then carried out on the ranked data rather than the actual data
When are non parametric tests used?
- When data is ordinal
- when data doesn’t seem to follow any particular shape or distribution
- assumptions underlying parametric are not met
- a plot of data appears to be very skewed
- there are potential influential outliers in the dataset
- sample size is small
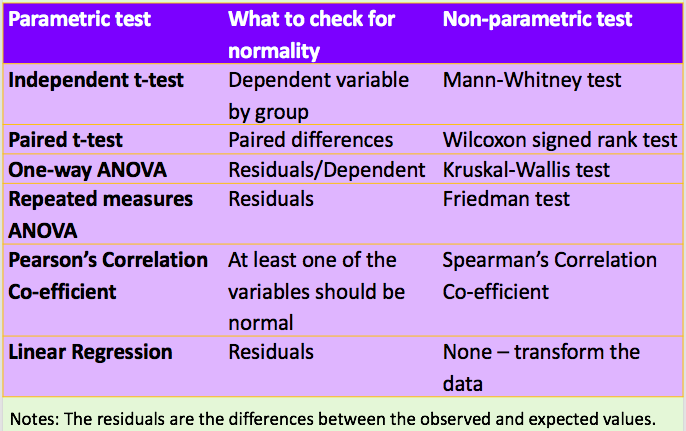
What can be done about non - normality?
•If the data are not normally distributed, there are two options:
- Use a non-parametric test
- Transform the dependent variable
•For positively skewed data, taking the log of the dependent variable often produces normally distributed values
Pair the non-parametric tests with the parametric tests if normality isn’t present.
Summary