What is a variable?
Any characteristic of an individual that can be measured or reported like age, sex or BMI
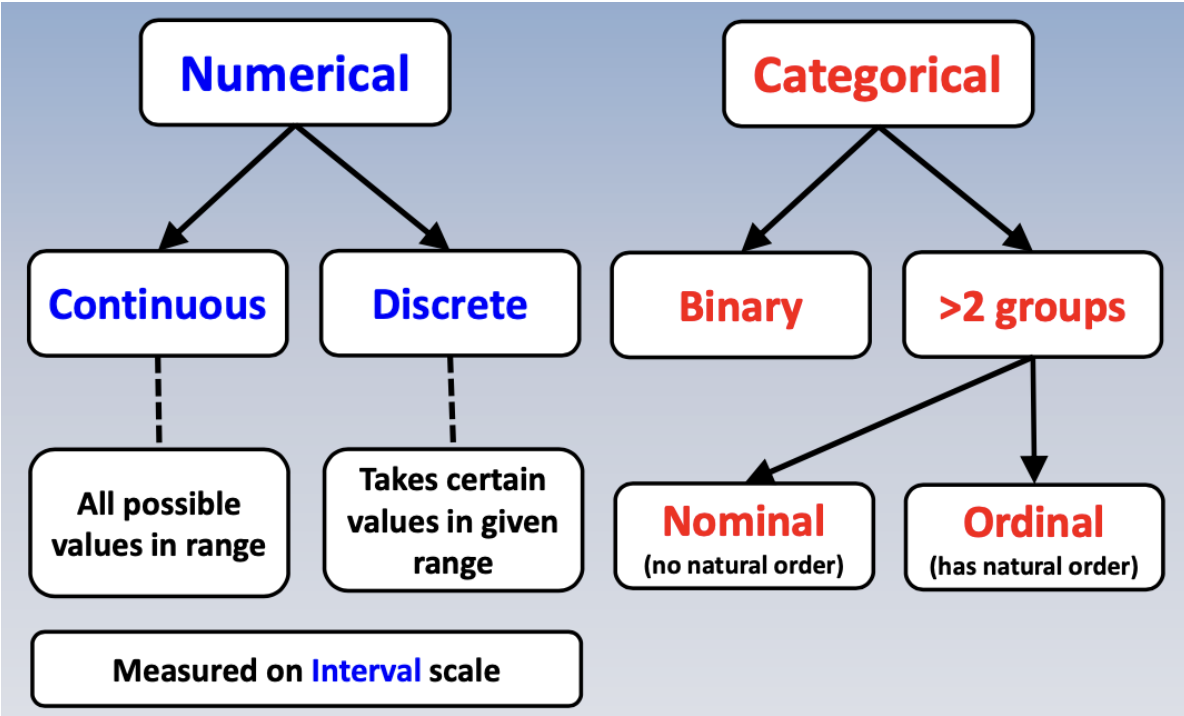
Variables can be classified as either numerical or categorical. Describe numerical variables
- Numerical variables:
→ quantitative
→ individuals are measured or counted
→ can be continuous (any value in a range) or discrete (certain values)
→ numerical variables are measured mostly on interval scales (the interval between points on the scale has precise numerical meaning)
Variables can be classified as either numerical or categorical. Describe categorical variables
- Categorial variables:
→ qualitative
→ individuals classified into groups
→ 3 types of categorical variables: binary, nominal, and ordinal
• Binary- can only take 2 values -mainly yes/no
• Nominal- more than 2 categories but no natural order
• Ordinal- more than 2 categories with a natural order
But, ordinal data doesn’t tell the differences between categories e.g. what is the highest level of education completed?..high school..bachelors.. etc
Draw a flow diagram to explain the difference between the types of variables
What are the methods of summarising each data type?
For numerical:
- Measures of central tendency (mean, median) if data is not normally distributed. Measures of spread if the data is normally distributed. (standard deviation, range)
For categorical:
- Frequencies
- Proportions
- Percentages
- Use tables & charts to do this
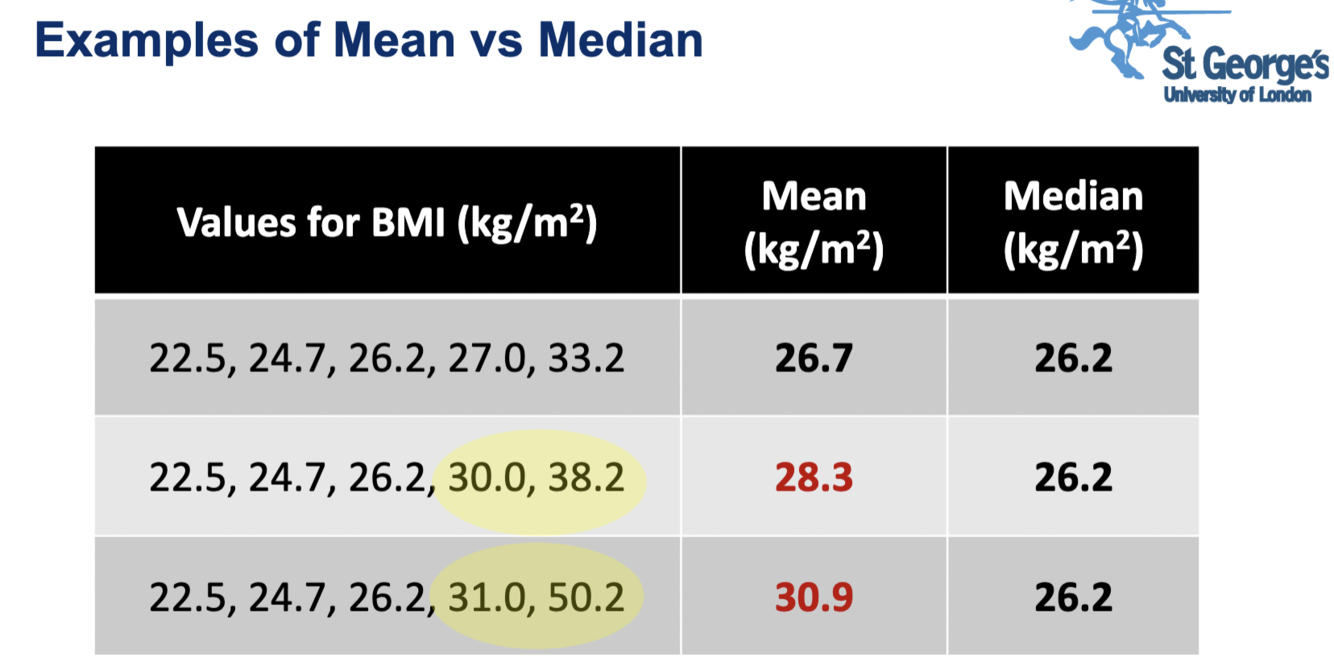
What is the difference between mean and median?
Mean is simply the average of all the values. Sum up all individual values & divide by number of ppl.
Median is the value such that 50% of data points lie at or above the median & 50% at or below it
Order data from low to high, take the middle value. If there is an even number = take average of central 2 values
When should we use mean vs median?
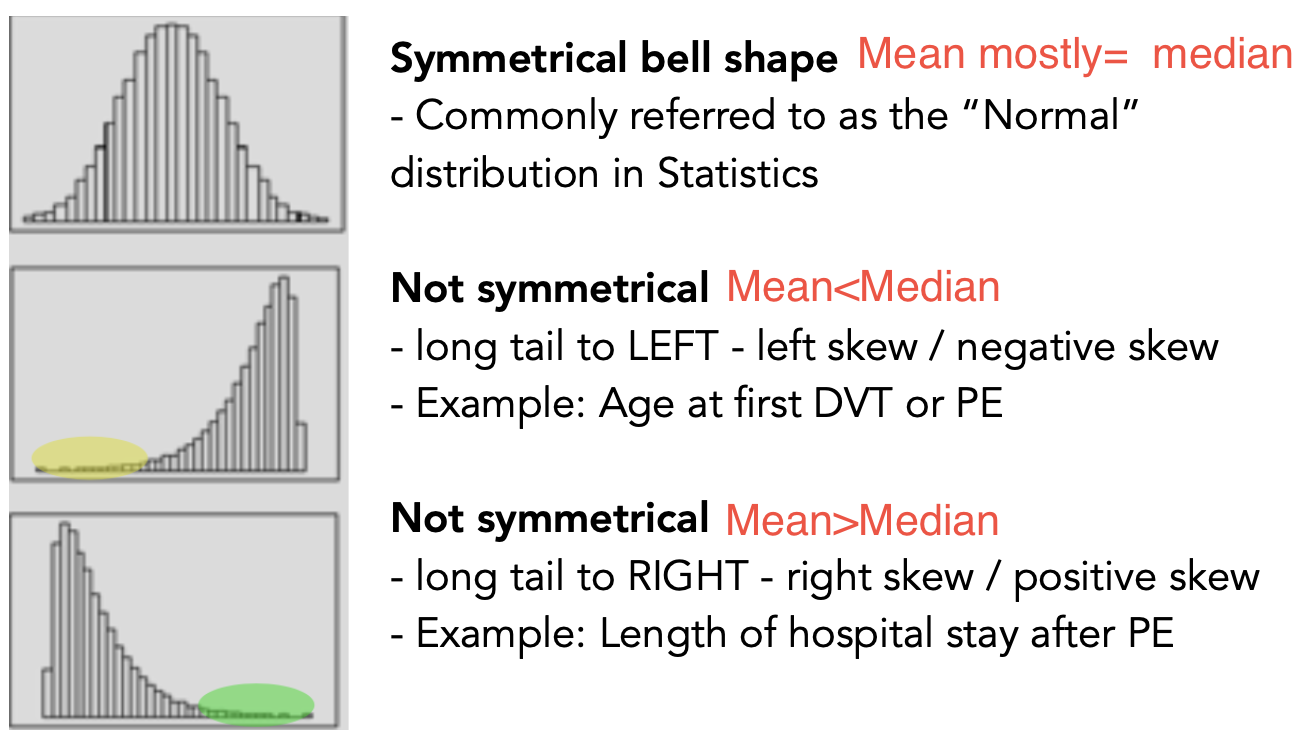
MEAN is good measure of the centre of a symmetrical distribution
– Much more useful in practice
– But over influenced by extreme values
MEDIAN is better for skewed distributions because it is only slightly affected by extreme values (no matter how big they are)
Describe what distribution curves show
How do you estimate a 95% reference range?
We are interested in the range of values from (apparently) healthy individuals for a particular measurement. Range may vary by sub-groups (age, gender)
Mean ± 1.96 x SD
→ 95% of the data lies between these limits IF data are normally distributed
-
PPS Sociology19
-
PPS Professionalism, Reflective practice8
-
Risky Health Behaviours5
-
Psychological Perspectives on Health3
-
Social aspects of nutrition16
-
Children's Ethics and Medical Law10
-
Chronic illness7
-
How Many People Die From Asthma?1
-
Clinical Trials to Treat Heart Disease12
-
Epidemiology and Public Health6
-
Data, Variables, Tables9
-
Stress, Illness and Coping14
-
Evidence Based Medicine7
-
Public Health and Chronic Kidney Disease3
