1
Q
Control charts
A
- Shewhart plots
- Cusum plots
- Cumulative sum chart
2
Q
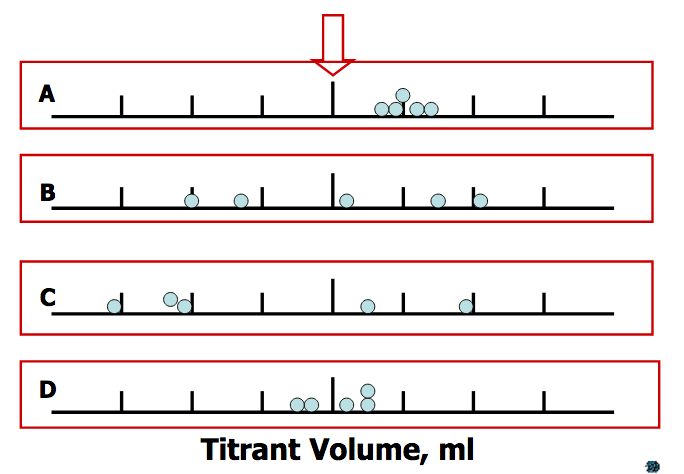
Random and systematic error
Dot plot
A
3
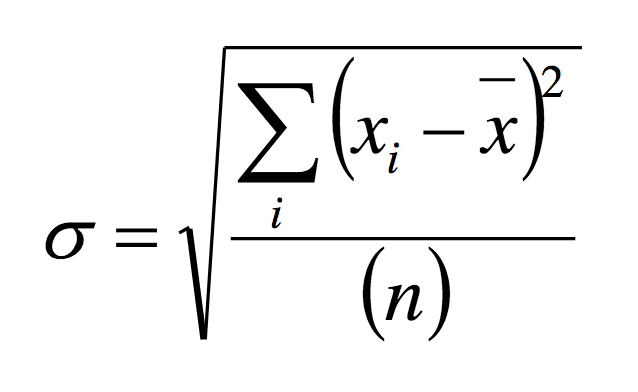
Q
Standard deviation of the entire population
A

4
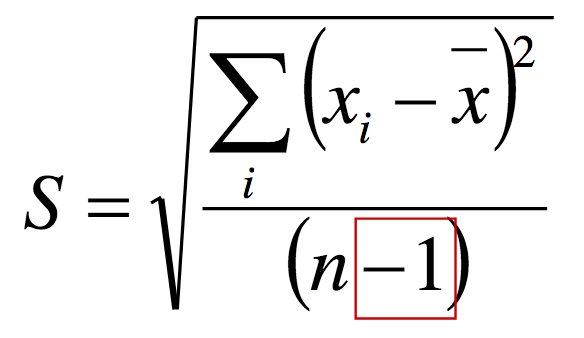
Q
Standard deviation of the population based on a sample
A
5
Q
Real mean
A
- Tank of product has real mean (u) and an actual SD (sigma)
- Samples from tank have a mean and SD which is an estimate of the true mean
- In order to use the sample results to estimate the tank (population) deviation (s) use n-1
6
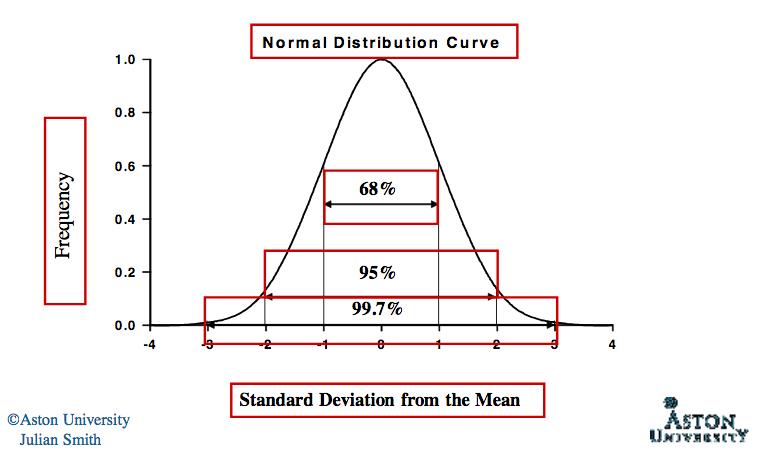
Q
Properties of the normal distribution
A
7
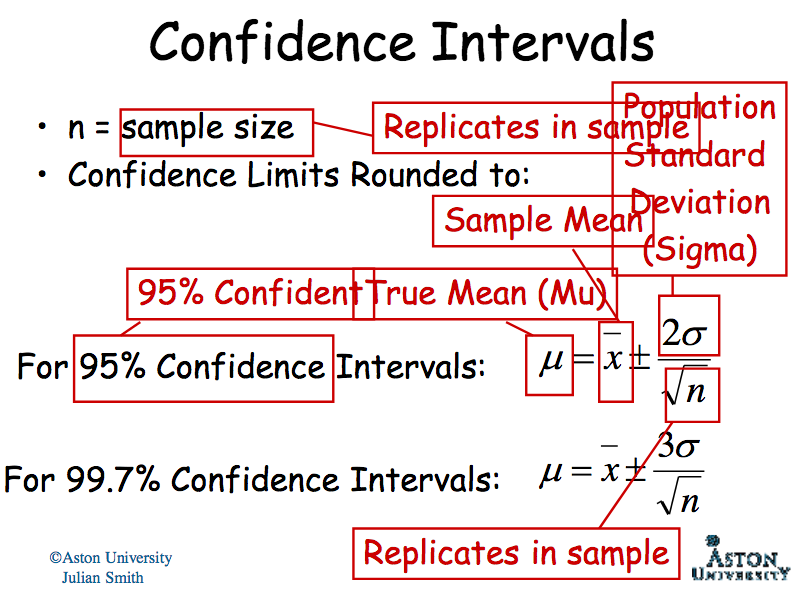
Q
Confidence intervals
A
- n= sample size- replicate in sample
- Confidence limits rounded to
- 95% CI= u= x + 2s / Square root of n
- (x= true mean) 2s= pop Sd n=replicatres in sample
- 99.7= same but with 3s
8
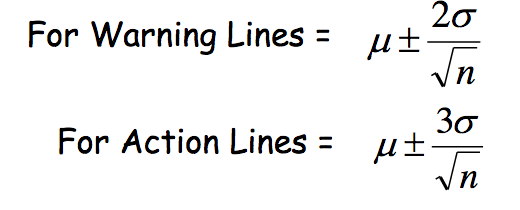
Q
Shewhart charts
A
- Over a long period of time we can assess the population deviation (sigma) (process capacity)
- n= sample size
- u= target mean
- CI rounded to
- warning lines
- Action lines
9
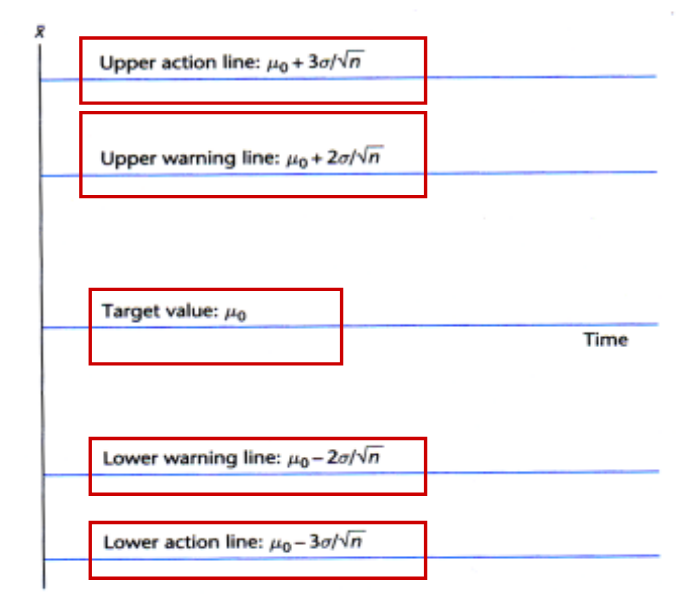
Q
Shewhart chart for mean values
A
10
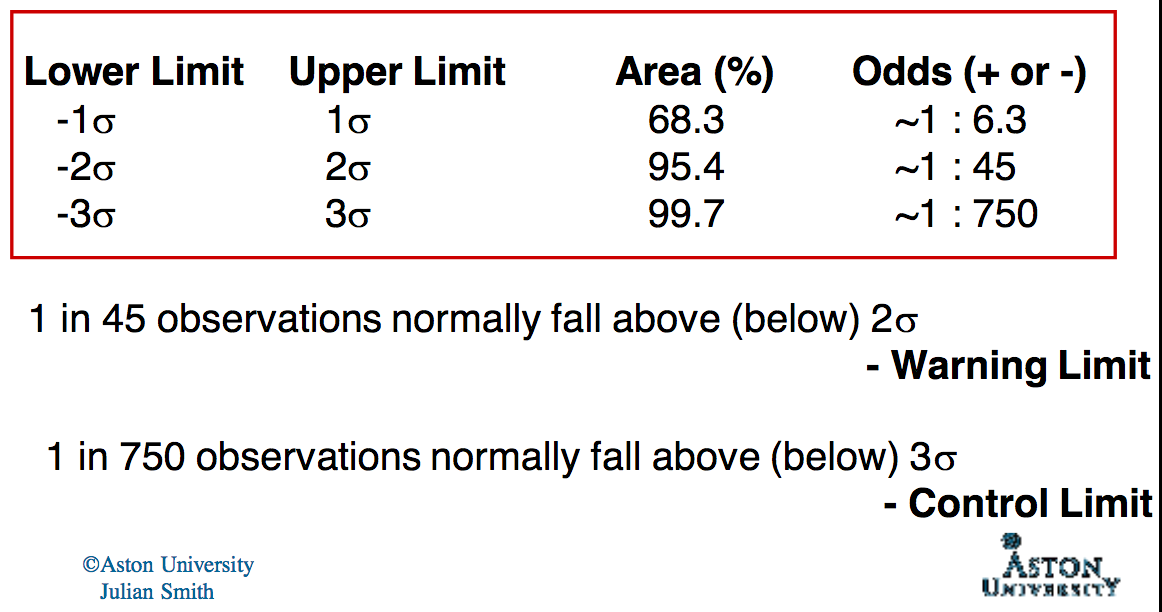
Q
Areas under the normal curve
A
- 1 in 45 obeservations normally fall above (below) 2sigma
- 1 in 750 normally fall above and below 3sigma
11
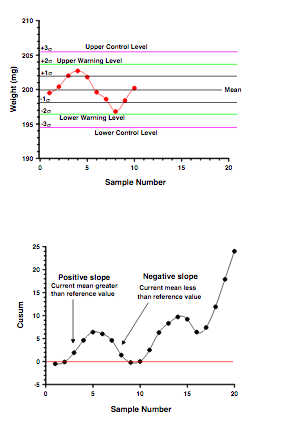
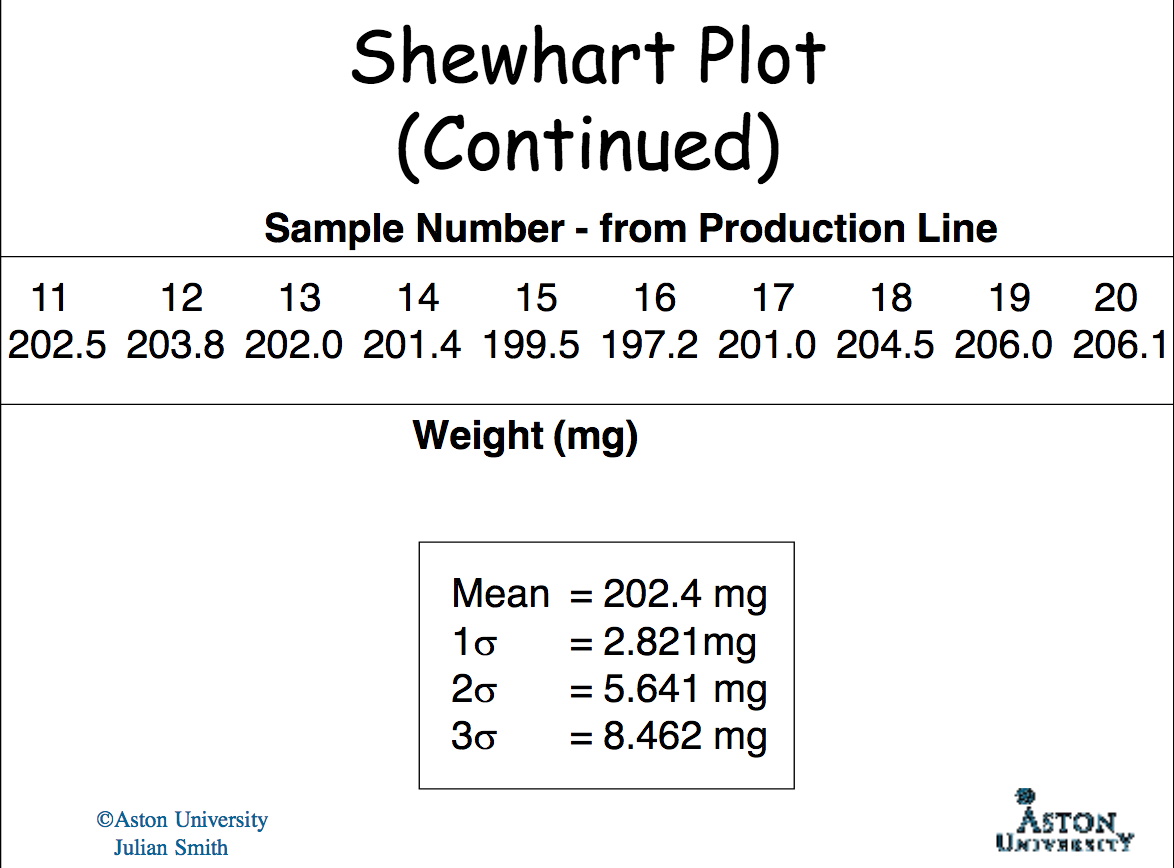
Q
Control charts Shewhart plots
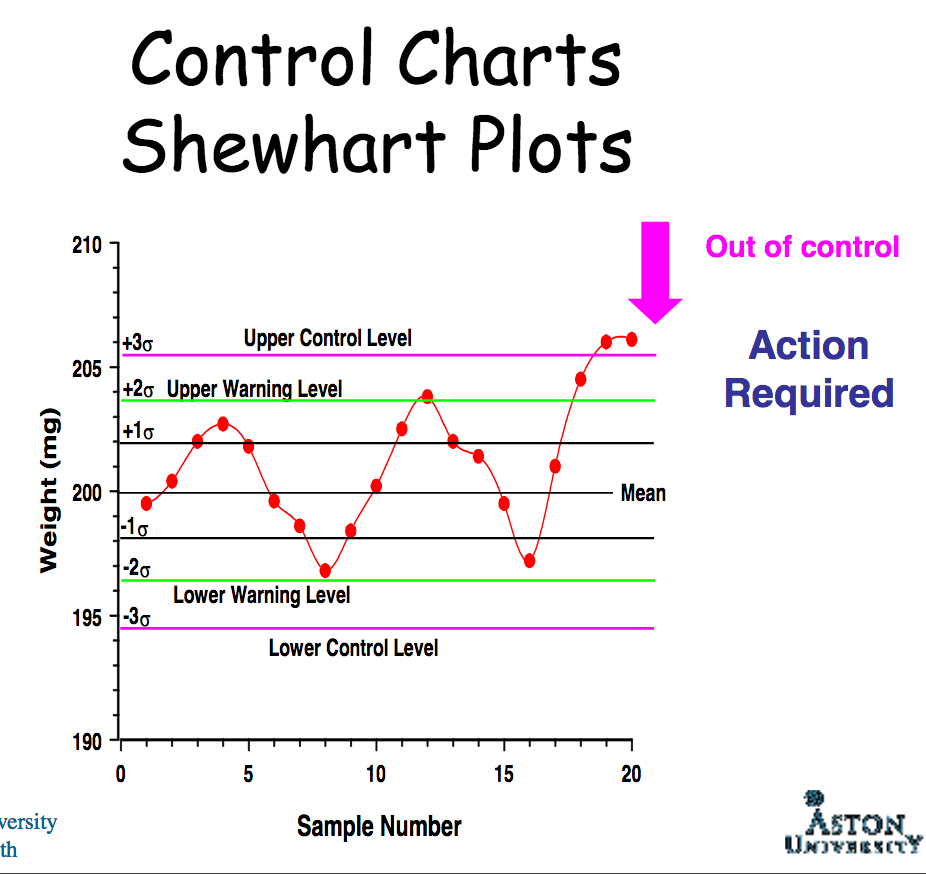
A
12
Q
Controls using shewhart plots
A
- Out of control examples
- Two successive points outside warning line
- One point outside action line
- Eight successive points lying one side of the target value line
- Establish other warning levels to enable correction before production stops
- E.G. six successive points lying one side of the target value line
13
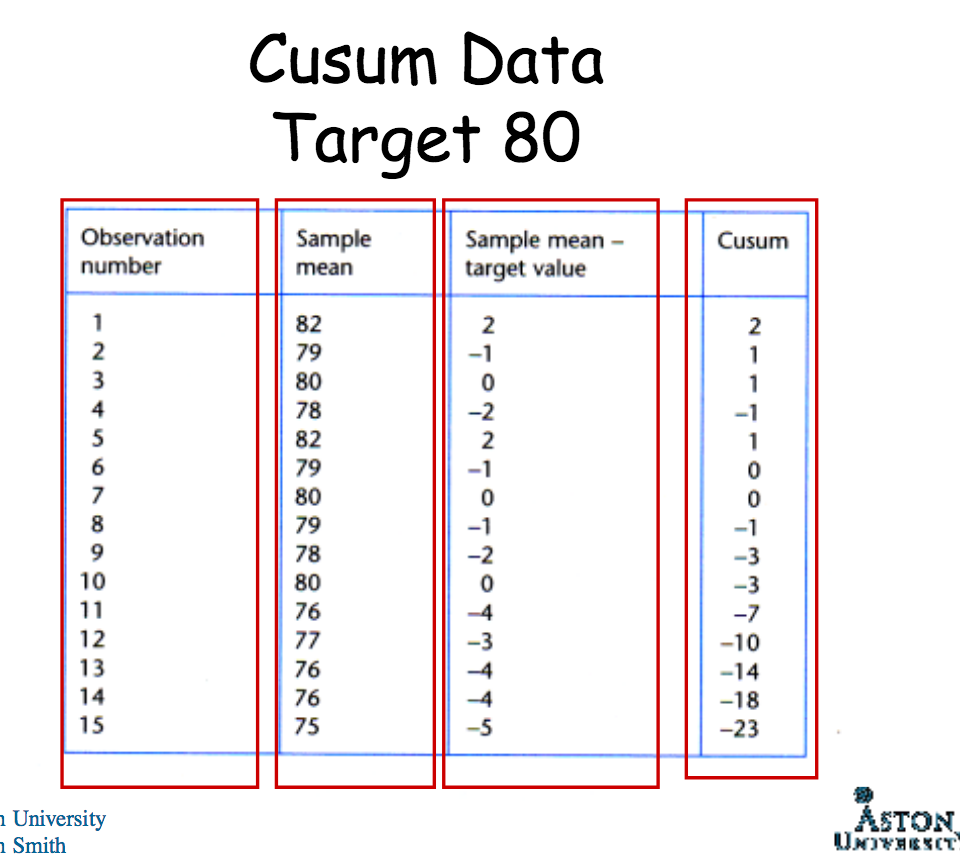
Q
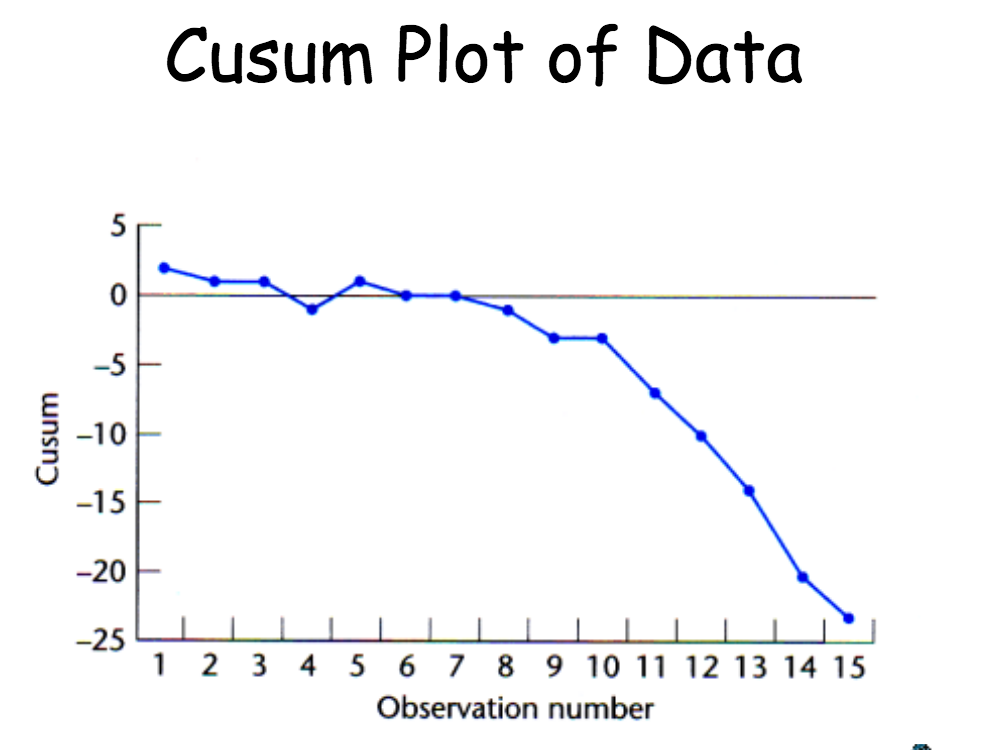
Cusum plot
A
- ARL- average run length
- This is the average number of measurements required to deyect a change in the process has changed
- This period of time can be length in shewhart plots
- This can be reduced by using cusum charts
14
Q
Shewhart v cusum plot of data
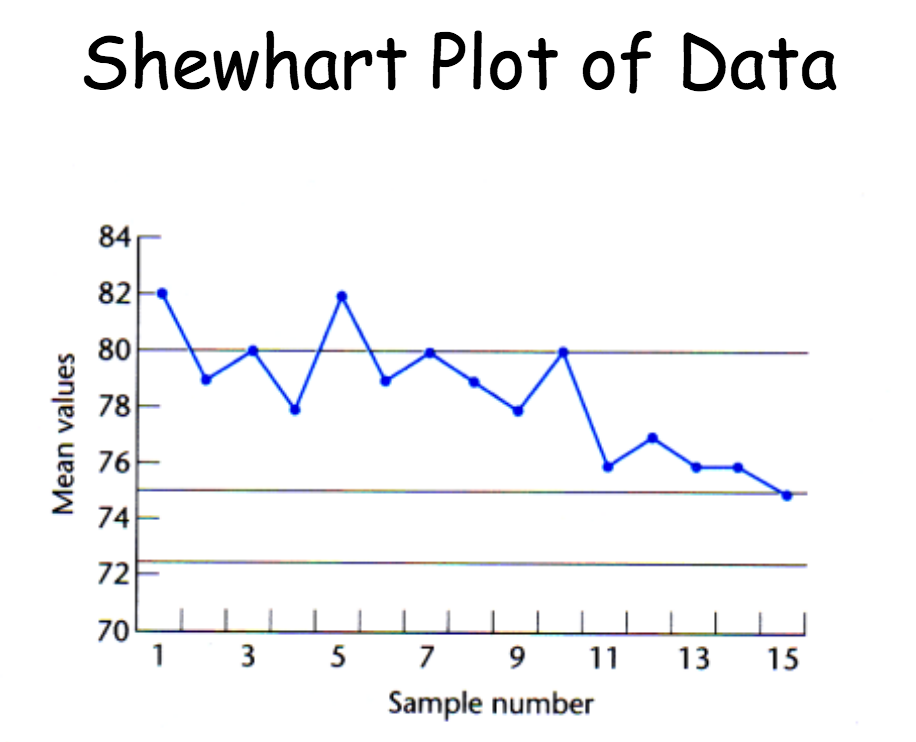
A
15
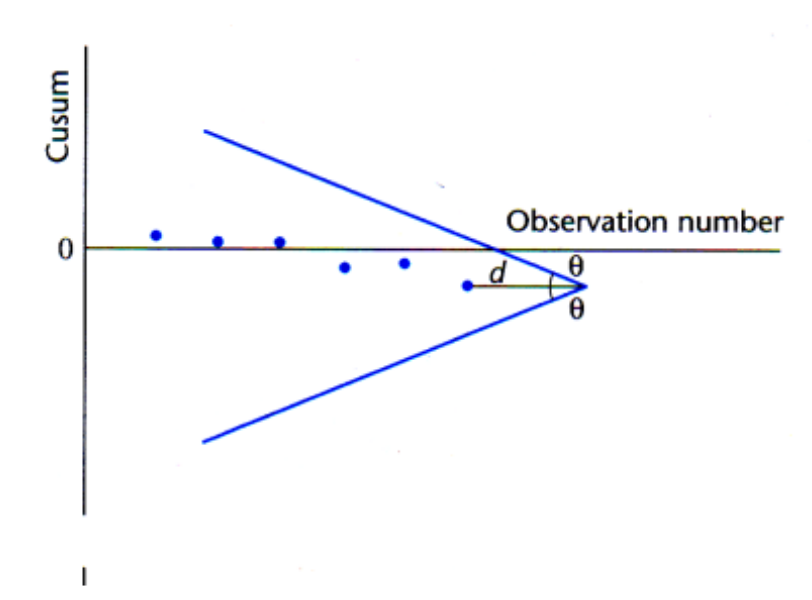
Q
Use of V-mask Initial data
A
- If points fall above or below the mask then the results are said to be out of control
16
Q
Data integrity
A
- Current regulatory hot topic
- The extent to which all data are complete, consistent and accurate throughoutout the data lifecycle
- From initial data collection and recording, through processing (including)
PH3704- Pharmaceutical technology
flashcards
Decks in class (22)
# Cards
-
Lec 1- Aseptics9
-
Lec 2- Aseptic15
-
Lec 3- Aseptics8
-
Lec 4-Aseptic13
-
Lec 5- Aspectics17
-
Lec 6- CIVAS11
-
Lec 7- Aseptics19
-
Quality assurance Lec-115
-
QA- Lec 225
-
Lec 8- Aseptics24
-
QA lec 312
-
QA-lec 40
-
QA- lec 516
-
QA- lec 612
-
Radiopharmaceutics46
-
Radiopharmaceutics (2)28
-
Radiopharmaceutics (3)11
-
Radiopharmaceutics (4)37
-
Radiopharmaceutics (5)29
-
Radiopharmaceuticals (4b)12
-
QA- Lec 716
-
QA- lec 827
