- What is a sampling distribution?
MODEL ANSWER:
A (hypothetical) distribution of the values for a statistic obtained by computing the statistic in each one of a large number of samples.
A sampling distribution or finite-sample distribution is the probability distribution of a given statistic based on a random sample. Sampling distributions are important in statistics because they provide a major simplification en route to statistical inference. More specifically, they allow analytical considerations to be based on the sampling distribution of a statistic, rather than on the joint probability distribution of all the individual sample values.
- What is the name for the standard deviation of the sampling distribution for a statistic?
The standard deviation of this statistic is called the standard error.
The standard error (SE) is the standard deviation of the sampling distribution of a statistic, most commonly of the mean.
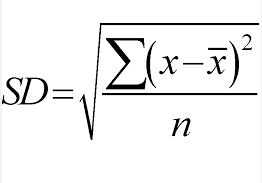
- How can you compute the S.D. of the sampling distribution of the mean, from statistics for a single sample?
MODEL ANSWER:
Take the sample S.D. and divide it by the square root of the sample size.
Other stuff..
The standard error (SE) is the standard deviation of the sampling distribution of a statistic, most commonly of the mean.
Step 1: Calculate the mean (Total of all samples divided by the number of samples).
Step 2: Calculate each measurement’s deviation from the mean (Mean minus the individual measurement).
Step 3: Square each deviation from mean. Squared negatives become positive.
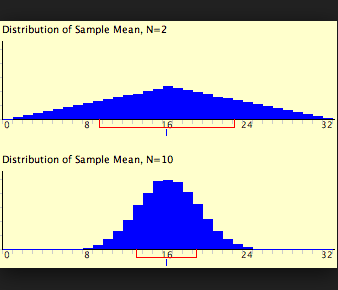
- For a mean, if the data in the sample is normally distributed, what will be the shape of the sampling distribution of the mean?
Normal -
A bell curve - this will change depending on the sample n
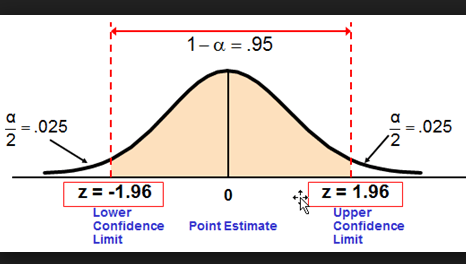
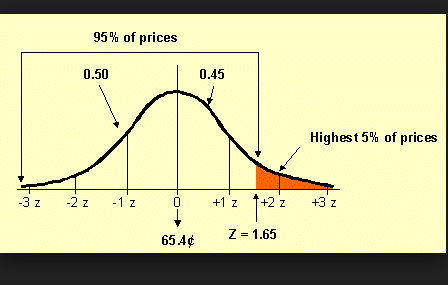
- What shape is the sampling distribution for a z-statistic?
A bell curve with z = 0 in the middle going out to z = -2 and more..
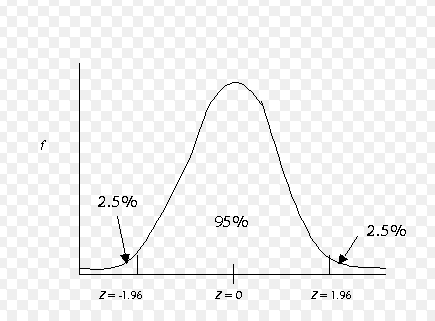
- If the area under the standard normal curve is 100%, what percentage lies under the curve to the left of the line at z=-1.96?
2.5% 0r .025
- If the area under a standard normal curve is 100%, what % lies under the curve to the right of a line at z=1.65?
5% or .05
- How does the shape of a t-statistic distribution differ from that of a z-statistic distribution?
It has flatter broader tails..
When n≥30, the sampling distribution of the sample mean becomes normal. If n≤30, the skewness of the population could influence the shape of the sampling distribution and make it not normal.
The t-statistic distribution may be lumpy from skewness due to low sample size
