- Uniformitarianism
The Earth formed and continues to form as the result of slow, consistent processes. This principle also implies that the Earth is very old.
- Catastrophism
The Earth formed and continues to form a the result of short catastrophic events. This principle also implies that the Earth is NOT that old.
- Actualism
The Earth formed and continues to form a the result of slow, consistent processes that are periodically interrupted by catastrophic events.
- Hazard
something that can cause problems or harm.
- “Natural” Hazard
Some natural place, event or process that can cause problems/harm.
- Disaster or Catastrophic Event
An event or process that has caused problems/harm. A significant catastrophe may be called a disaster.
- Exposure. (give example)
Refers to the proximity someone or something has to a hazard.
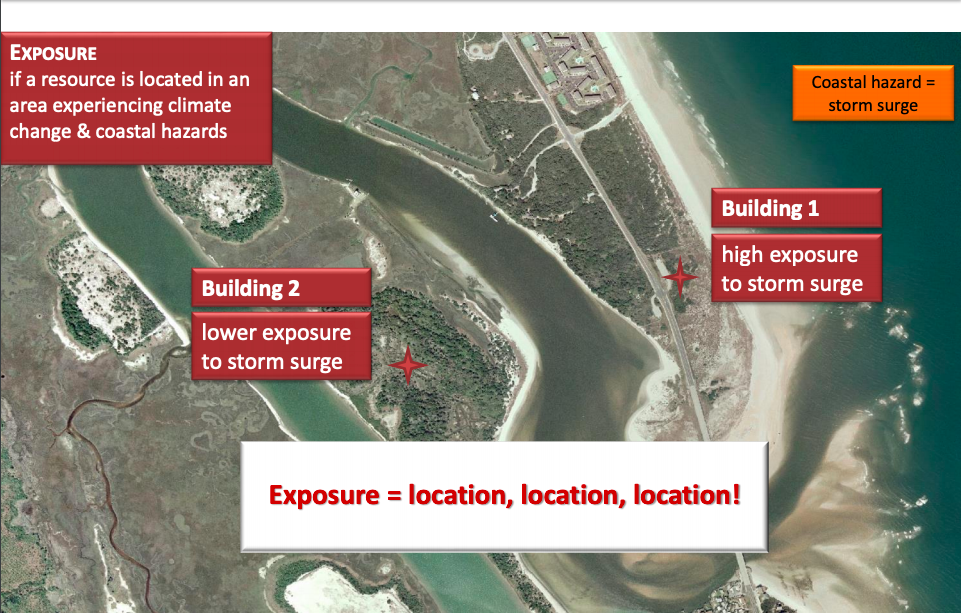
- What factors affect exposure?
The proximity someone or something has to a hazard, location.
- Sensitivity. (give example)
A measure of how someone or something may be affected by a particular hazard.
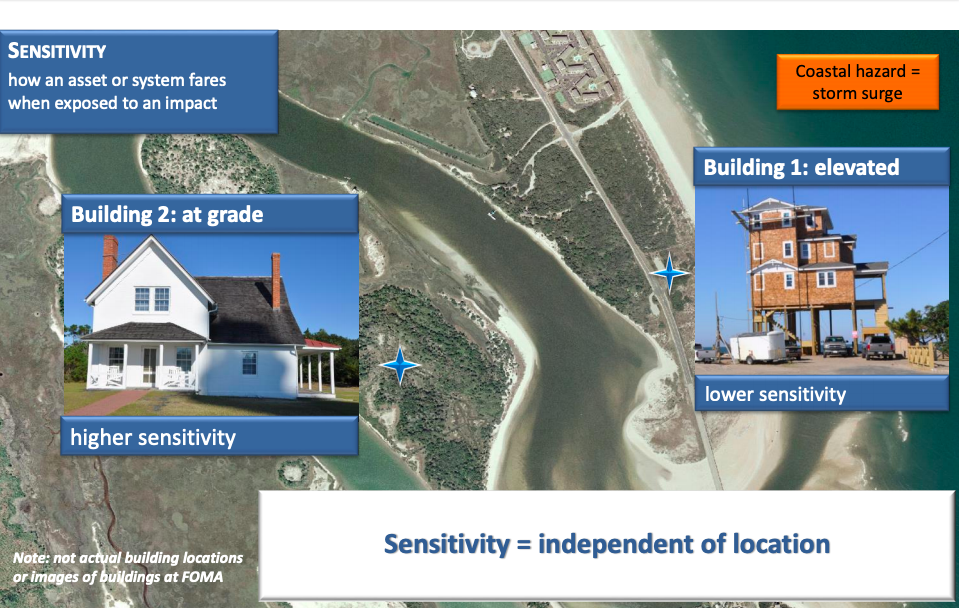
- What resources are needed to reduce sensitivity?
- Awareness and Preparedness: information and education
- Plans to avoid, recover from a hazard/catastrophe
- The material needs in place to support plans
- Vulnerability. (give example)
A combination of exposure and sensitivity.
- It takes into account a person’s or thing’s proximity to a hazard
- and their ability to deal with it
- to determine what will happen when catastrophic event takes place.
- What resources are needed to reduce vulnerability?
- Reducing exposure means removing the hazard.
- Reducing sensitivity means realizing the hazard and preparing for it.
Reducing either of these will reduce vulnerability.
- Discuss the relative differences between exposure, sensitivity, and vulnerability as they pertain to mass wasting events, in mid-latitude regions (i.e. Canada) as compared to subtropical regions.
For both these places mass wasting in the form of avalanches and flows is a significant hazard.
Both locations therefore have a high degree of exposure.
Sensitivity, however, differs.
It is less in BC because we are aware of the hazard and can avoid it.
Sensitivity is higher in El Salvador because, despite awareness, steep terrain is harder to avoid.
In El Salvador, there is less land - it is a small country - and land that is safer is often owned and/or controlled by others.
- Why do people live near potentially dangerous natural areas?
- They are unaware of the hazard.
- They choose to ignore the hazard or downplay it.
- They have no choice.
- What is the relationship between wealth and mortality rates during a natural disaster?
In a wealthy place, where sensitivity is less, the result of a catastrophe is often mostly property damage. Mortalities are much less.
In poorer areas where sensitivity is higher, there is usually less property damage but mortality is higher.
In Canada, we have more stuff to break, but we have good medical care.
- What is risk?
The chance or odds that something will happen.
- Probability is the likelihood that a particular event will happen. Most measures of probability rely on observation and experience. Essentially, the size and frequency of past events are used to determine when and how similar events will take place in future. While the probability of an event can be determined to some degree if circumstances are known, there is a reason why forecasting a particular event is not so simple. Briefly explain what it is.
When creating a graph that compares flood frequency with size there is often more information on smaller more frequent floods.
What is absent is information of the rarer, potentially larger floods.
The ability then to predict larger, more catastrophic floods is suspect at best.
What’s more is that when this larger, catastrophic event does occur, the prediction graph may ave to be re-written
- While the probability of an event can be determined to some degree if circumstances are known, there is a reason why forecasting a particular event is not so simple. Briefly explain what it is.
When creating a graph that compares flood frequency with size there is often more information on smaller more frequent floods.
What is absent is information of the rarer, potentially larger floods.
The ability then to predict larger, more catastrophic floods is suspect at best.
What’s more is that when this larger, catastrophic event does occur, the prediction graph may have to be re-written.
- Is it possible to predict a natural event? Why or why not?
It is not possible to predict a natural catastrophe. Predictions are of more precise statement of the possibility of something happening and precise events such as: “a magnitude 7.0 earthquake on Vancouver Island the week of Jan 7 to 13, 2019.”
- Is it possible to forecast a natural event? Why or why not?
It is possible to forecast a natural catastrophe. These are more general statements about a situation such as: “there will be an earthquake in British Columbia in the next 50 years”.
- What is a fractal?
A fractal is something (i.e. a river) that behaves the same regardless of size.
- What use are fractals to understanding the Earth? Give an example.
Understanding fractals helps to understand natural processes including hazards.
Magnitude
The severity of the hazard, its size and frequency
Perception
Awareness of a hazard
-
Chapter 130
-
Chapter 355
-
Chapter 429
-
WTG - Chapter 14
-
WTG - Chapter 28
-
WGT - Chapter 312
-
Chapter 55
-
Chapter 6 and 715
-
Chapter 10 - part 130
-
Chapter 10 - part 219
-
Chapter 1717
-
WTG - Chapter 6, Chapter 74
-
Chapter 44
-
Chapter 218
-
MIDTERM CH. 521
-
Tsunami2
-
Floods/Rivers23
-
Chapter 1015
-
Chapter 43
-
Waking the Giant8
