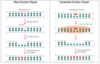
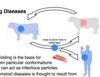
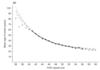
Normal vs Poor Control of Blood Glucose
normal control has fasting levels around 5mM and small rapid spikes of blood glucose after meals.
poor control has fasting levels around 12mM and exaggerated spikes of blood glucose after a meal.

Burning Glucose
directly after a meal we burn glucose (glycolysis plus the TCA cycle at incredibly high rates to generate ATP and remove glucose from the blood). Requires oxygen.
Lowers the level of glucose in the blood.

Acetyl CoA - function and sources
substrate used in the TCA cycle to form ATP. Three ways to generate:
- glycogen to glucose through gluconeogenesis. then glycolysis to form pyruvate then oxidation to form acetyl CoA.
- triglyceride to free fatty acid through lipolysis. Beta-oxidation forms acetyl CoA. Can use free fatty acids anywhere but the brain. Can go in the reverse and synthesize free fatty acids from acetyl CoA.
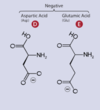
- protein to amino acids by proteolysis then deamination and oxidation to form acetyl CoA.

Storage of Glucose
stored in the form of glycogen in the liver but can be rapidly converted by the liver into glucose which is then exported to the blood to maintain glucose levels in the fasted state.
liver can hold approximately 120 grams of glycogen
basal metabolic rate of glucose to CO2 is 10 grams per hour
have enough glycogen in liver for 12 hours.

Storage of Fatty Acids
stored as triglycerides (TAG or triacylglycerides) mainly in adipose cells. Fatty acid travels in the blood as two forms:
- free fatty acid which are available for uptake and metabolism
- TAG held in blood lipoproteins VLDL which is not readily available for uptake and metabolism.
lipolysis releases TAG to free fatty acids (remember 1 TAG contains 3 fatty acids)
everywhere but the brain can use free fatty acid to make acetyl CoA.
Storage of Amino Acids
stored mostly as protein in muscle. Average muscle protein has a half-life of less than a week so process of protein to amino acid and reverse is natural.
insulin stimulates growth and protein synthesis which aids in the recovery of muscle mass after fasting. Or if insulin is low (starved state) you accelerate breakdown of body protein to amino acids to acetyl CoA.
muscle protein is the most readily available for proteolysis to produce glucose in the starved state.
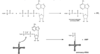
Glucose –> Fatty Acid
In the well fed state, insulin stimulates the liver to make fatty acids from glucose obtained from the diet by binding to receptors on the cell surfaces of the liver and adipose which causes activation of key metabolic enzymes that catalyze rate determining steps.
insulin also promotes localized release and uptake of fatty acid by adipose

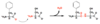
Fatty Acids –> Ketone Bodies
Starved state. rising levels of catabolic hormones: epinephrine and glucagon. And falling levels of insulin.
hydrolization of TAG to release free fatty acids.
Brain cannot metabolize fatty acids for energy.
In the liver, ketone bodies can be formed. Cannot make glucose from fatty acids!!
Ketone Bodies
In the starved state, production of fatty acids from TAG are sent into the blood stream. In the liver, ketone bodies are formed which are released into the blood. Most cells can convert ketone bodies to acetyl CoA, and it is faster than using fatty acids to form acetyl CoA. Ketone bodies acidify the blood and give the person “ketone breath” which smells like acetone.

Well-Fed Phase: Hormones, fuels and results
Hormone Levels (relative to average levels throughout the day): insulin is high and glucagon and catecholamines are low.
Fuels in blood (relative to average): glucose is high, amino acids are high. Free fatty acids and ketone bodies are low.
Results: high levels of insulin direct all sensitive cells to take up, store and burn glucose. The liver and muscle make glycogen and the liver makes fatty acids from glucose (stored as TAG).

Phase II: 12 hours after meal - hormones, fuels and results
Hormone Levels: insulin low. glucagon and catecholamines are high.
Fuels in Blood: glucose is low. free fatty acids and ketone bodies are high.
Results: adipose hydrolyzing TAG to produce free fatty acid. free fatty acid uptake in liver to form ketone bodies. liver is hydrolyzing glycogen to make glucose. liver is running glucoeneogenesis.

Starved State (1 week after meal): hormones, fuels and results
Hormone Levels: insulin very low. glucagon and catecholamines are very high.
Fuels in Blood: glucose is very low. free fatty acids and ketone bodies are very high.
Results: Adipose continues to release free fatty acids to blood. liver uses free fatty acids to make ketone bodies. But brain still needs about 6g glucose/hour. The liver is out of glycogen. Only source of glucose is gluconeogenesis in liver. Carbon sources for gluconeogenesis are amino acids, lactic acid and glycerol (from breakdown of TAG).

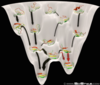
Pathway Regulation
The rate of flux down a pathway is controlled by the activity and concentrations of the enzymes that catalyze the rate determining steps for that pathway. Two kinds: internal and external.
Internal Regulation
by metabolites of metabolic pathways. Short-term and focused on keeping the cell functioning. Example is ATP levels of a cell.
- feedback inhibition of rate limiting enzymes by products of pathway
- feedforward activation of rate limiting enzymes by substrates of the pathway.
- regulation by the relative concentrations of ATP/ADP/AMP.
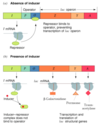
External Regulation
by hormones via the stimulation of second messenger systems caused by binding of the hormones to receptors on the cell surface.
Control of glycolysis and gluconeogenesis in the liver by hormones
- Glycolysis is controlled by the enzyme PFK (phosphofructokinase). AMP and insulin (increases levels of F2,6-BP which is positive effector) are positive allosteric effectors. And have a decrease in F1,6-BP activity (responsible for gluconeogenesis).
- Gluconeogenesis is controlled by the enzyme F-1,6-BP. AMP is a negative allosteric inhibitor. F2,6-BP levels fall. High levels of the two hormones glucagon and epinephrine. And decrease in PFK activity.

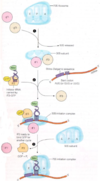
Control of glycogenolysis in muscle and liver
- Glycogen synthesis: hormone is insulin. enzyme being regulated is glycogen synthetase (glycogen synthesis) and glycogen phosphorylase (glycogen breakdown). insulin dephosphorylates both enzymes, making the synthetase active and the phosphorylase inactive. Result is glycogen synthesis.
- Glycogen Breakdown: Hormones are glucagon and epinephrine. Both phosphorylate the enzymes making the glycogen synthetase enzyme inactive and the glycogen phosphorylase active. Result is glycogen breakdown.
- Note that liver has the glucose-6-phosphatase enzyme allowing glucose to be made. This means that the liver can produce glucose that can be exported to the blood but muscles cannot. Glycogen breakdown is for internal muscle use only.
- Calcium and ADP are positive allosteric effectors of glycogen phosphorylase

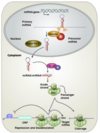
Glucogenic Liver
producing glucose via glycogenolysis and gluconeogenesis due to glucagon and epinephrine external regulation.
- glycogen undergoing glycogenolysis to glucose which is exported.
- Alanine and lactate act as carbon sources to form pyruvate and undergo gluconeogenesis to form glucose to be exported. glycerol is a positive allosteric effector of gluconeogenesis.
- Fatty acids from adipose undergo the TCA cycle to produce ATP and ketone bodies which are exported.

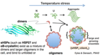
Lipogenic Liver
importing glucose to convert to glycogen, fatty acids/TAG exports. Controlled by insulin.
- glycolysis to form ATP from glucose.
- glycogen synthesis to form glycogen from glucose
- up regulation of lipids as VLDL

Effect of insulin on muscle
promoting glucose uptake, glycogen synthesis, burning of glucose. Also, low levels of free fatty acids in blood force muscle to burn glucose.

Effect of epinephrine on muscle with O2
glycogenolysis and glycolysis. large amounts of free fatty acids are taken up by muscle to form acetyl CoA. Starting to export lactate (produced from pyruvate) to send to the liver for gluconeogenesis. “Cori Cycle”

Effect of epinephrine and energy change on anaerobic muscle.
no TCA cycle (no oxygen). glycolysis is run to obtain ATP. lactate is exported to liver for gluconeogensis. Glycogenolysis is also run to produce glucose for glycolysis.

Review of Insulins effects on enzymes (five enzymes)
- glycogen synthetase activation: glycogen synthesis
- pyruvate kinase activation: glycogen synthesis
- acetyl CoA carboxylase activation: fatty acid biosynthesis
- F-2,6-BP activation: glycolysis
- glycogen phosphorylase inactivation: glycogen breakdown
Increasing Insulin: effect on glucose uptake
increases in liver adipose and muscle