Why need data visualisations
- Humans easily recognise patterns
- faster understanding than a mass of numbers or text
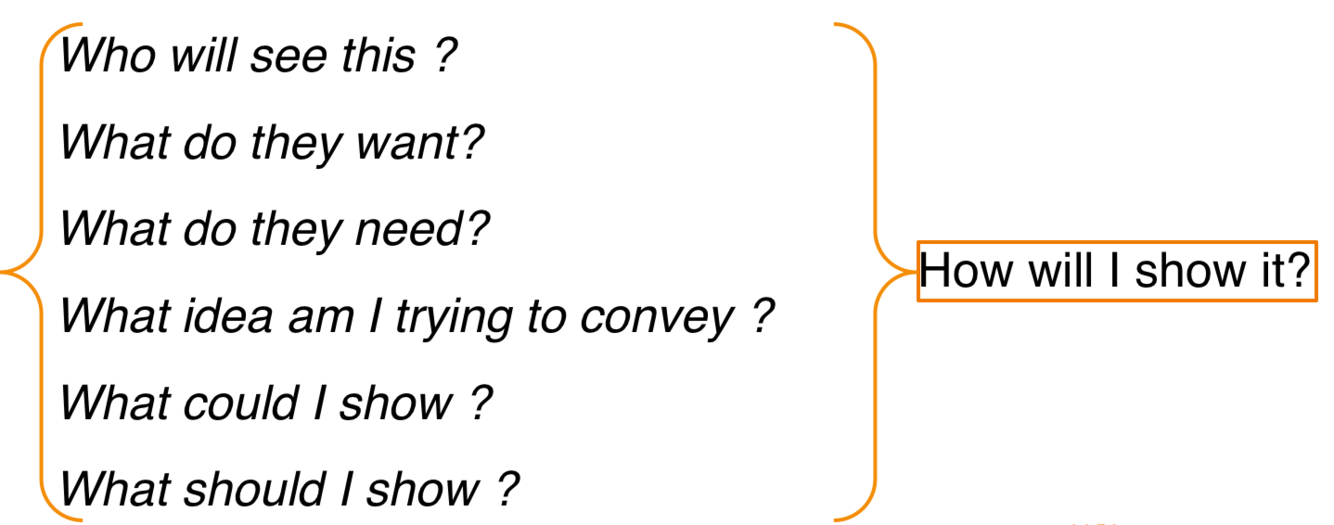
information is meaningless without context - expand
Without context information nor charts cannot be evaluated.
It’s important to answer these questions:
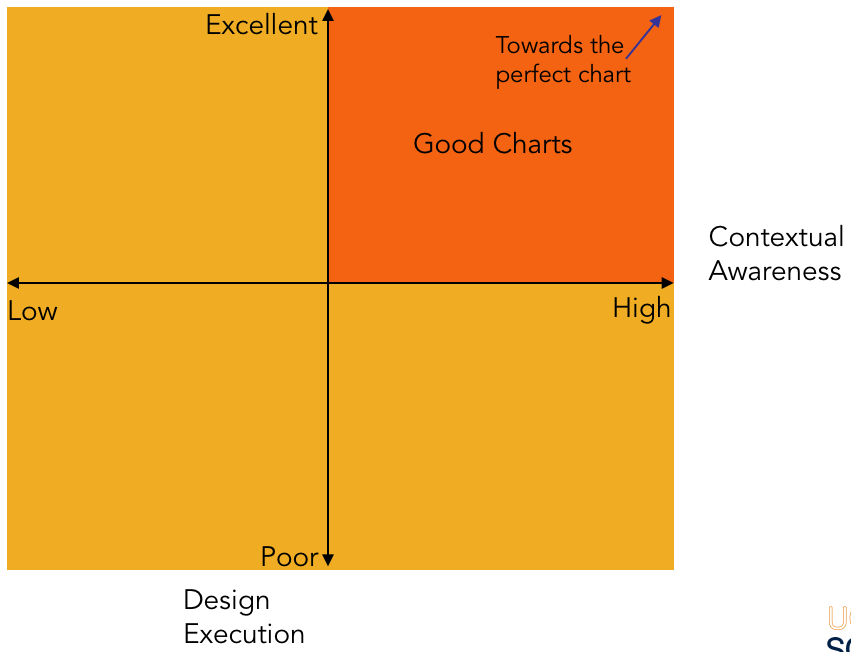
The Good Chart Matrix
Contextual Awareness: What am I trying to Say, To Whom and where?
Design Execution: How well is this chart constructed?
- Requires principles that help you understand why you’d choose a bar chart or a line chart or no chart at all.
- A perfectly relevant visualization that breaks a few presentation rules is far more valuable than a perfectly executed, beautiful chart that contains the wrong data, communicates the wrong message, or fails to engage its audience.
- The more relevant a data visualization is, the more forgiving, to a point, we can be about its execution.
Three interrelated trends are driving the need to learn and practice visual thinking.
1. Increasing volume of visualizations.
- Raised expectations due to constant exposure to better dataviz.
2. Increasing data volume and velocity.
- So much information hitting us so fast that it demands a abstract and simplified way of communication - dataviz.
3. Increasing participation.
- Everybody’s doing it because it has become cheap and easy.
Conventions and Metaphors
We rely on conventions and metaphors.
We are hardwired and shaped by upbringing to see and expect the world like this.
5 things we do when a chart hits our eyes
1. We don’t go in order.
- Visuals aren’t read in a predictable, linear way, as text is.
- Instead, we look first at the visual and then scan the chart for contextual clues about what is important.
- What this means:
- “write” charts spatially, from the visual outward
2. We see first what stands out.
- Our eyes go directly to change and difference, such as unique colors, steep curves, clusters, or outliers.
- What this means:
- Whatever stands out should match or support the idea being conveyed. If it doesn’t, it will distract from and fight for attention with the main idea.
3. We see only a few things at once.
- A visual that contains tens, hundreds, or thousands of plotted data points shows us a forest instead of individual trees. The more data that’s plotted in a chart, the more singular the idea it conveys.
- What this means:
- To focus on individual data points, plot as few as possible
4. We seek meaning and make connections.
- What this means:
- If visual elements are presented together, they should be related in a meaningful way; otherwise viewer creates false relationships.
5. We rely on conventions and metaphors.
- We use learned shortcuts to assign meaning to visual cues on the basis of common expectations (green is good, red is bad).
- What this means:
- Embrace conventions and metaphors when creating visuals, otherwise creates confusion.
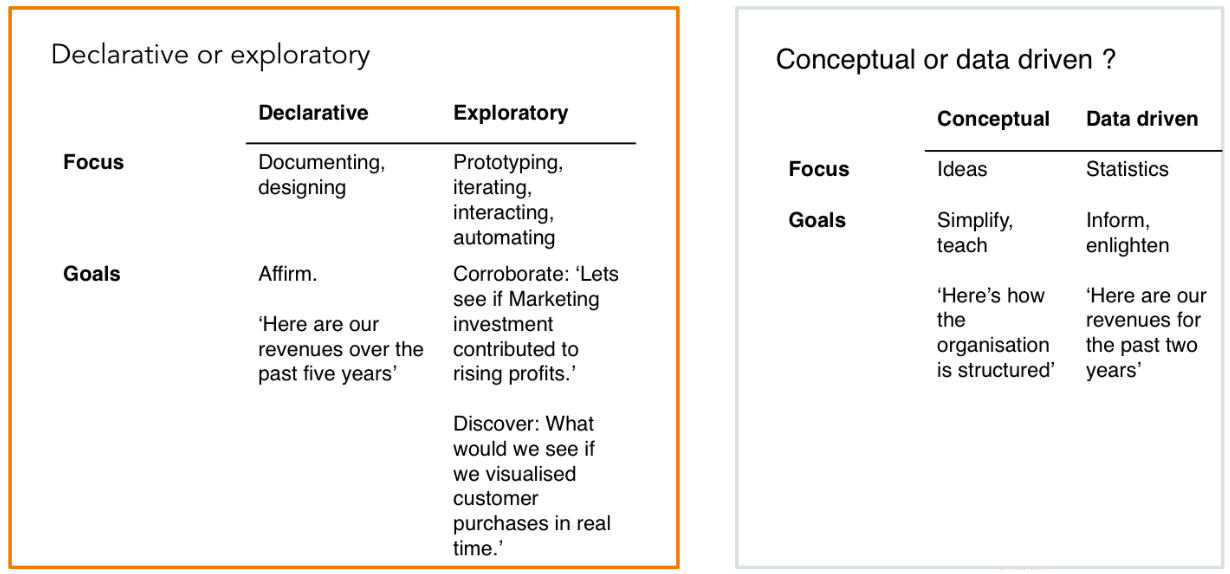
2 questions about the nature and purpose of your visualization
1. Is the information conceptual or data-driven?
- Either you’re visualizing concepts and qualitative information or you’re plotting data and information.
- But notice that the question is about the information itself, not the forms that might ultimately be used to show it.
2. Am I declaring something or exploring something?
- Declarative: well-designed, finished products;
- e.g. presenting sales data
- Confirmatory: looking to understand something, less formal
- Exploratory: unsure what you are looking for, rough design; good for brainstorming and discoveries
Concepts & Models
Concepts arise as abstractions or generalisations from experience; from the result of a transformation of existing ideas; or from innateproperties.
All models are wrong, some are useful.
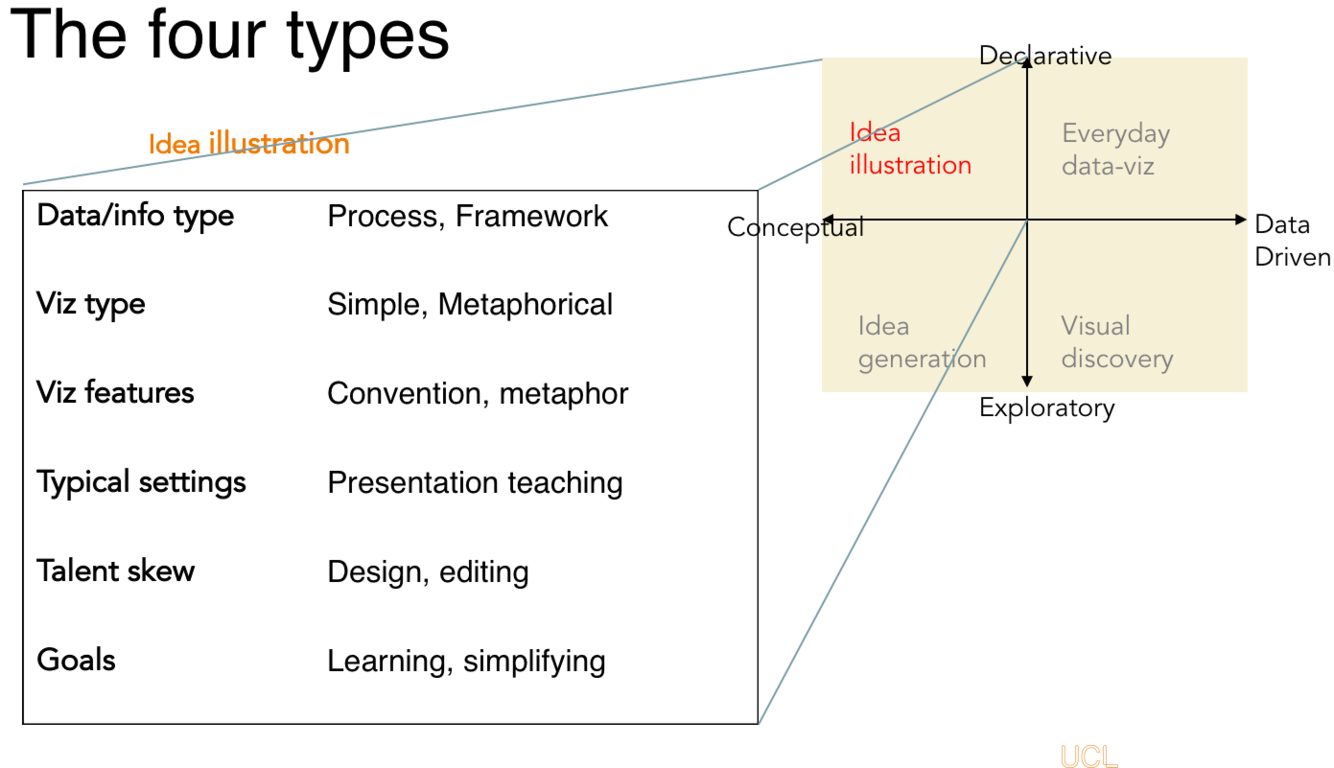
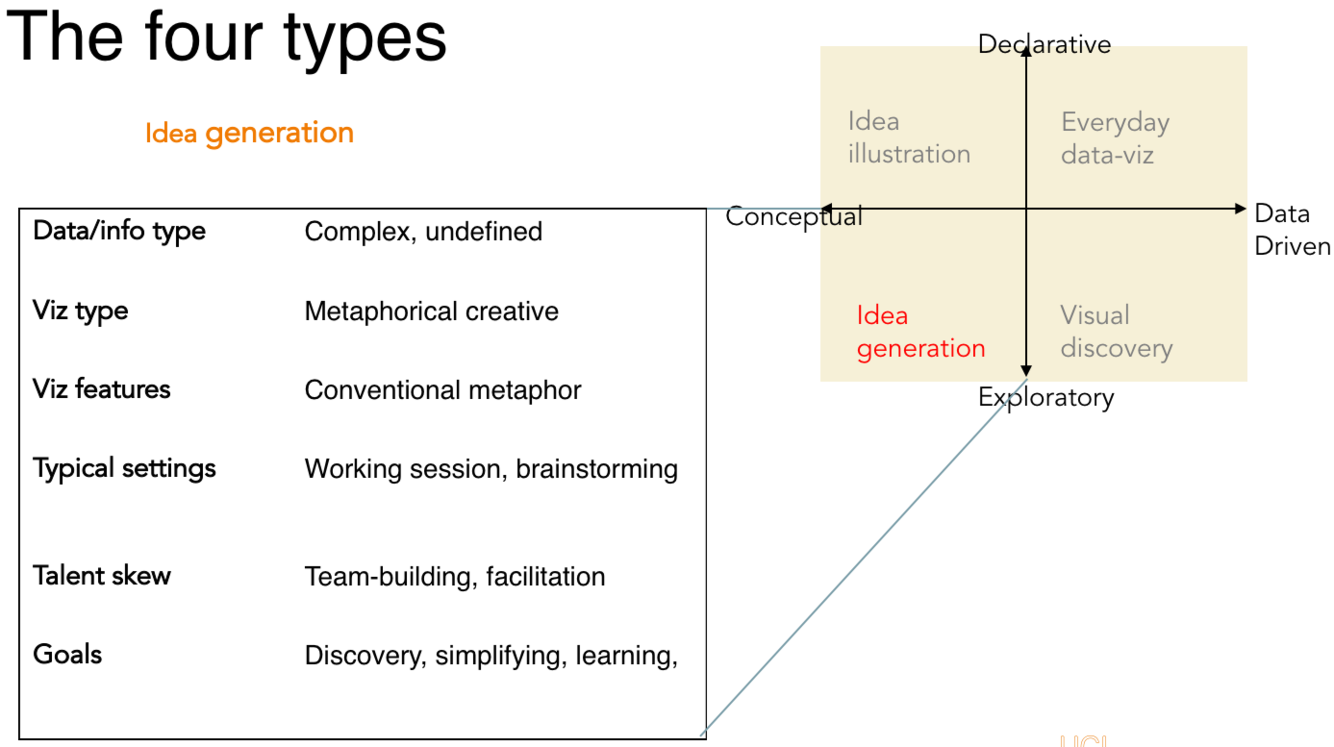
4 types of visualisations (matrix)
Helps make more appropriate decisions about the needed forms, time and skills.

Idea illustration quadrant in detail
At their best, declarative, conceptual visualizations simplify complex ideas by drawing on people’s ability to understand metaphors (trees, bridges) and simple conventions (circles, hierarchies).
Examples:
- organisational charts
- decision trees
- cycle diagrams
Idea generation quadrant in detail
Explore ideas using non-data visuals
- whiteboard
- back of a napkin
Visual discovery quadrant in detail
Actually two categories - 3 possible types of tasks: declarative, confirmatory, and exploratory.
Confirmatory applies only to data-driven charts.
- A hypothesis can’t be confirmed or disproved without data.
- Soft distinction. Confirmation is a kind of focused exploration, whereas true exploration is more open-ended. The bigger and more complex the data, and the less you know going in, the more exploratory the work.
Visual confirmation. Answer two questions:
- Is what I suspect is true actually true?
- What are some other ways of looking at this idea?
- The scope of the data here is manageable, and the chart types you’re likely to use are common (not necessarily).
- Confirmation usually doesn’t happen in a formal setting; it’s the work you do to and the charts you want to create for presentations. That means your time will shift away from design and toward prototyping that allows you to iterate on the data and rapidly visualize and re-visualize.
Visual exploration.
- usually data scientists and business intelligence analysts
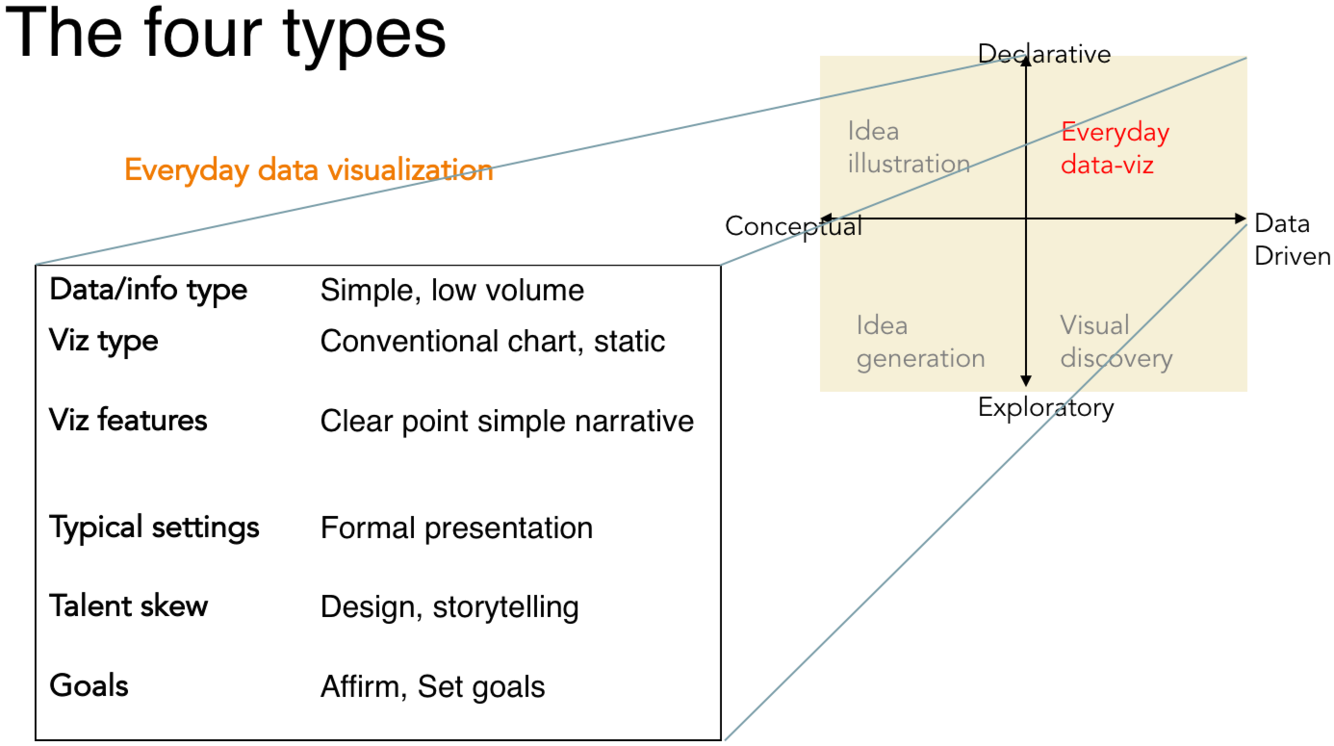
Everyday dataviz quadrant in detail
The data sets tend to be small and simple.
Goal: give people factual information based on data
What are BI applications
Deliverables by the BI team
- For business people to use in their analysis
- Usually, build several BI applications at a time
Deliverables can be
- Report
- Dashboard
- Scorecard
- Data visualization
- Ad hoc query
- OLAP cube
- Predictive model
- Data model
Role of Requirements in BI Applications + 2 types of requirements
- Foundation for a successful BI solution
- Development team uses these requirements to:
- design
- develop
- deploy BI systems
- Functional requirements: what the users will get; use cases
- Non-functional requirements: define qualities and constraints
- qualities define the properties and characteristics which the delivered system should demonstrate
- constraints are the limitations, standards and environmental factors which must be taken into account in the solution
- e.g. availability, performance, security, operability
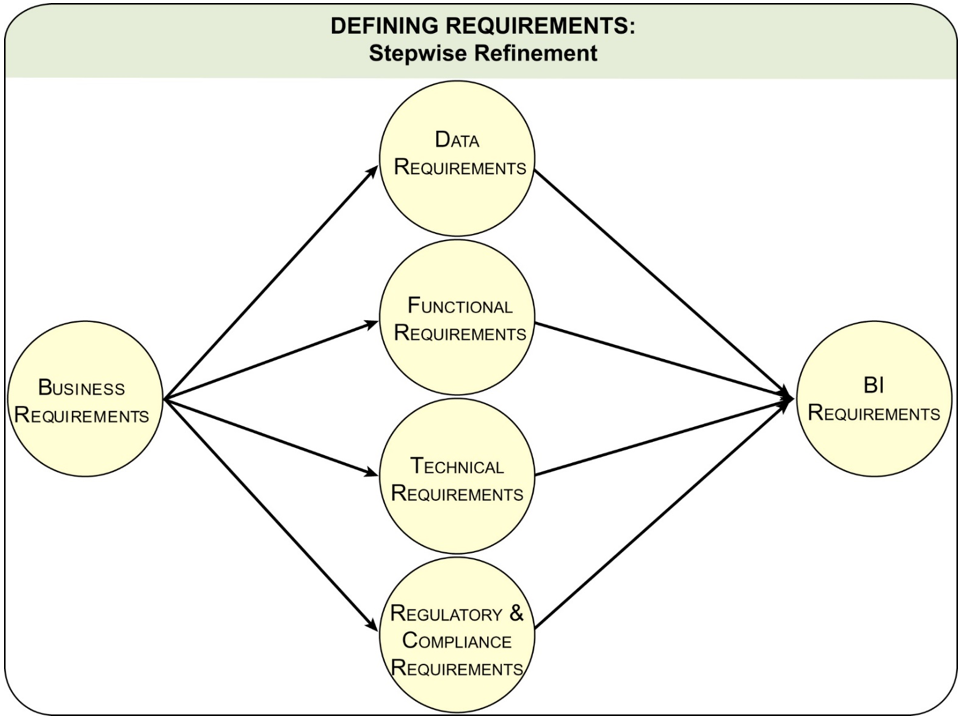
Draw stepwise refinement of requirements
Stepwise refinement is the process of taking business requirements and going deeper into the details to define data, functional, technical, and regulatory requirements.
Stepwise refinement is also called functional decomposition.
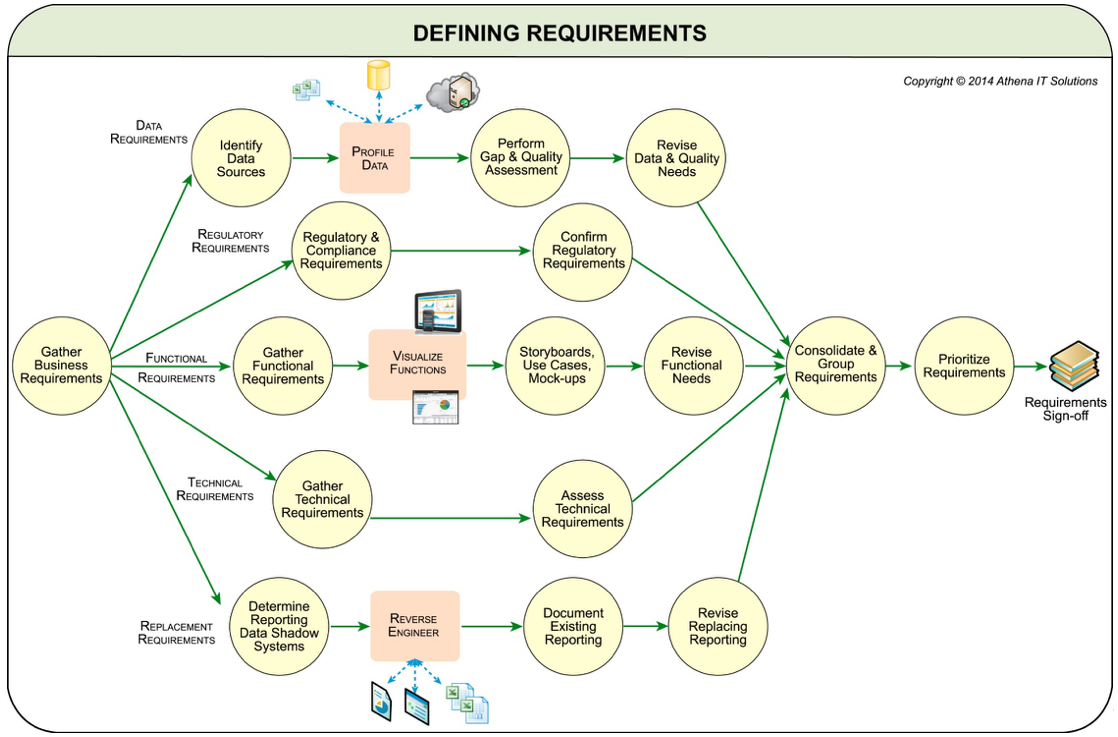
Defining requirements workflow
Data Profiling - structure and content of input data
Visualize Functions - use storyboards, mockups, use cases, wireframes, prototypes
Replacement Requirements - Data Shadow Systems - stuff the business unit has already built for its own reporting and analysis (Excel, etc.) The project’s aim is to get that into a properly developed and maintained BI solution, to protect against a number of potential problems, e.g. loss of the person who built the system, obsolescence of the technology used to build it, difficulty in keeping up with changes in underlying data
Next step after requirements have been gathered
- Now need to develop BI content specifications
- Starting point for design, development of BI applications
- BI lends itself to an iterative and incremental methodology
- Mix of waterfall and agile
Waterfall Approach
Sequential (non-iterative) software design process
- Conception
- Initiation
- Analysis
- Design
- Construction
- Testing
- Production/implementation
- Maintenance
5 steps in application specification
- Build up an application specification (initiation)
- Specify the data
- Manage business transformation for the application
- Clarify business users
- Estimate, costs needed to deliver
- Build up an application specification
- Name and identifier
- Description – short - business purpose
- evaluates usefulness, clarifies who pays
- Category,
- this is a functional grouping, expense tracking
- e.g. sales performance
- Business processes – supported by the application
- Application specification: Data Specifications
- Data sources, e.g. EDW, OLAP cube, SoR
- Data structure - XML, OLAP cube, NoSQL
- Table names
- Column names
- Column data type
- Status in the data source
- Exists, ready for use
- Exists, but needs to be transformed
- Does not exist, needs to be obtained from a SoR
- Business transformations for this application
Filters, business rules, algorithms used on input data
- Specific to this BI application
- Over and above data integration transformation
Business transformations for analysis
- Calculate measures and KPIs
BI Analytical style to be used
- Reports, dashboards etc.
- Business users of the application
- Business owner
- Business contact
- The owner usually delegates to a contact
- BI owner – responsible for project delivery
- BI developer
- Business priority, relative to other BI applications